Figure 1.

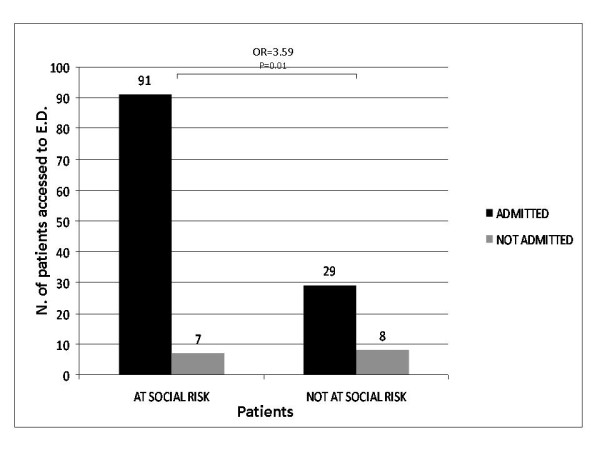
Evaluation of Hospital admission/not admission in "at social risk" vs. "not at social risk" patients: "at social risk" patients were admitted more frequently than "not at social risk" patients (OR = 3.59, 95% CI: 1,15 to 11,12; p = 0.01).

Evaluation of Hospital admission/not admission in "at social risk" vs. "not at social risk" patients: "at social risk" patients were admitted more frequently than "not at social risk" patients (OR = 3.59, 95% CI: 1,15 to 11,12; p = 0.01).