
Figure 9.
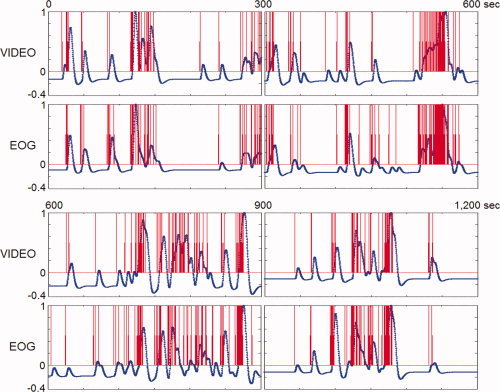
Timing of REMs using video‐recording versus EOG. Eye movements were timed from video‐recording and EOG that were obtained simultaneously in an out‐of‐magnet study (shown in red), then convolved with hemodynamic function (shown in blue). The hemodynamic impulse response had a six‐second latency. There are five data points in one second. Regardless of the method of timing eye movements (video‐recording, EOG, or other), the step right before correlation with fMRI data is to convolve with hemodynamic function. Therefore, these common end products (the curve derived from video‐recording and the curve from EOG‐recording, both shown in blue) were used in comparing video and EOG methods. Correlation between those two curves was highly significant (r s = 0.84; P < 0.00005).