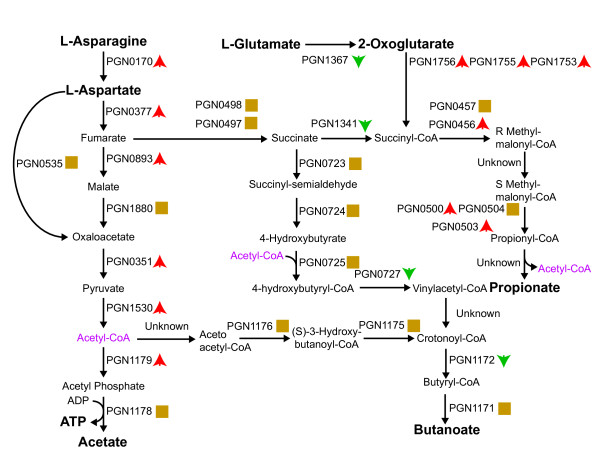
Figure 2.
Metabolic Map of Energy and Cytotoxin Production. Proteins catalyzing each step are shown by their P. gingivalis PGN designation. Red up arrows indicate increased levels upon internalization, green down arrows decreased levels, and yellow squares no statistical change. Acetyl-CoA appears as a substrate and product at multiple points and is shown in purple. Metabolites and metabolic precursors discussed in the text are shown in bold.

