
Figure 7.
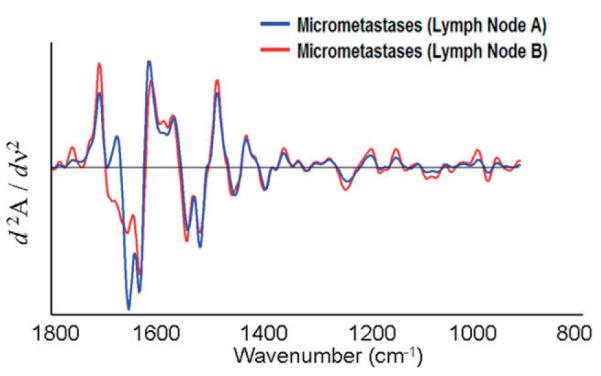
(online colour at: www.biophotonics-journal.org) Mean second derivative cluster spectra of the micro-metastases shown in Figures 2 and 7. The spectra shown cover the entire 900 to 1800 cm-1 range, although only certain portions may have been used for analysis.