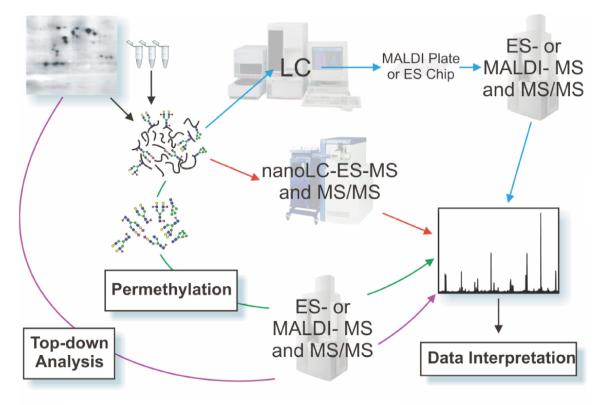
Figure 1.
A simplified glycoproteomic experimental workflow is shown, illustrating common approaches to glycoproteomic analysis. Samples take the form of slices or spots excised from single or multi-dimensional polyacrylamide gels, or batches of cells, fluids, immunoprecipitates or tissue extracts. Analytical approaches can broadly be categorised as “top down” or “bottom up”. The former, illustrated by a purple arrow, begins with work on purified samples of glycoproteins in an attempt to identify the intact molecular weight profile by direct MALDI-TOF MS or by ES-MS. By subtracting the known or inferred mass of the protein component, the type and extent of glycosylation may then be deduced. In “bottom up” approaches, which incidentally are essential for describing the detailed glycosylation profile of any protein, the glycoprotein is digested enzymatically and/or chemically, ideally with high-specificity procedures, and the resulting peptide/glycopeptide mixture is mapped mass spectrometrically either by on-line (red arrows) LC-ES-MS followed by MS/MS analysis of signals of interest, or by off-line (blue arrows) strategies involving ES- or MALDI-MS and MS/MS approaches. Prior to these separation and mapping procedures, various strategies for enrichment of glycopeptides may be introduced, including lectin binding (see text). Parallel glycomic analyses (illustrated by the green arrow) are an invaluable feature of the “bottom up” approach involving enzymatic or chemical release of the glycans followed by MALDI-TOF MS or ES-MS mapping of the glycan populations, usually as permethyl derivatives (see text), providing information about specific glycans and their relative amounts, which can then be compared and matched with data at the glycopeptide and overall glycoprotein levels.

