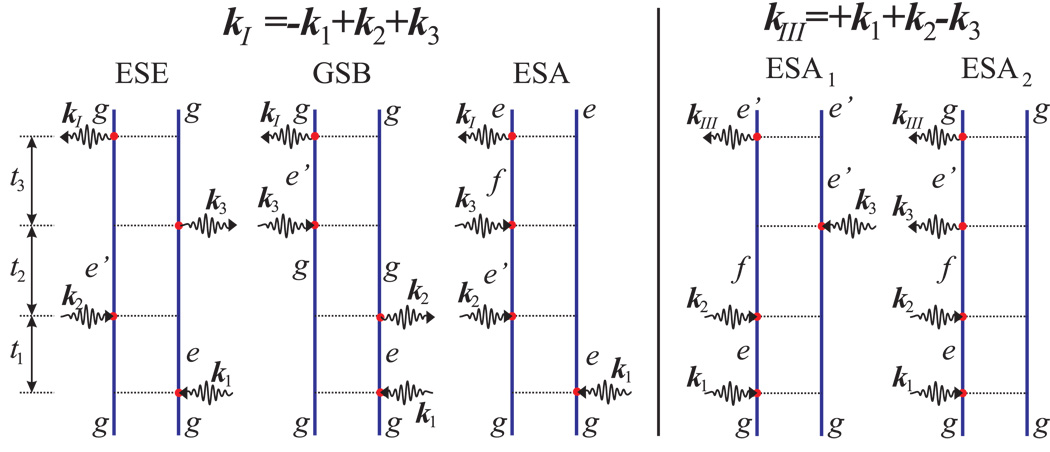
Figure 2.
Feynman diagrams for two 2D techniques with wavevectors kI and kIII. Incoming and outgoing arrows represent the interaction events, labels indicate states of the system during various intervals between interactions. ESA - excited state absorption, GSB - ground state bleaching, ESE - excited state emission. For SkI : the density matrix during (t1,t2,t3) is (ge, é e, é g) for ESE, (ge, gg, é g) for GSB and (ge, é e, fe) for ESA. For SkIII both diagrams are of ESA type. The states of the density matrix are (eg, fg, f é) for ESA1, and (eg, fg, é g) for ESA2.

