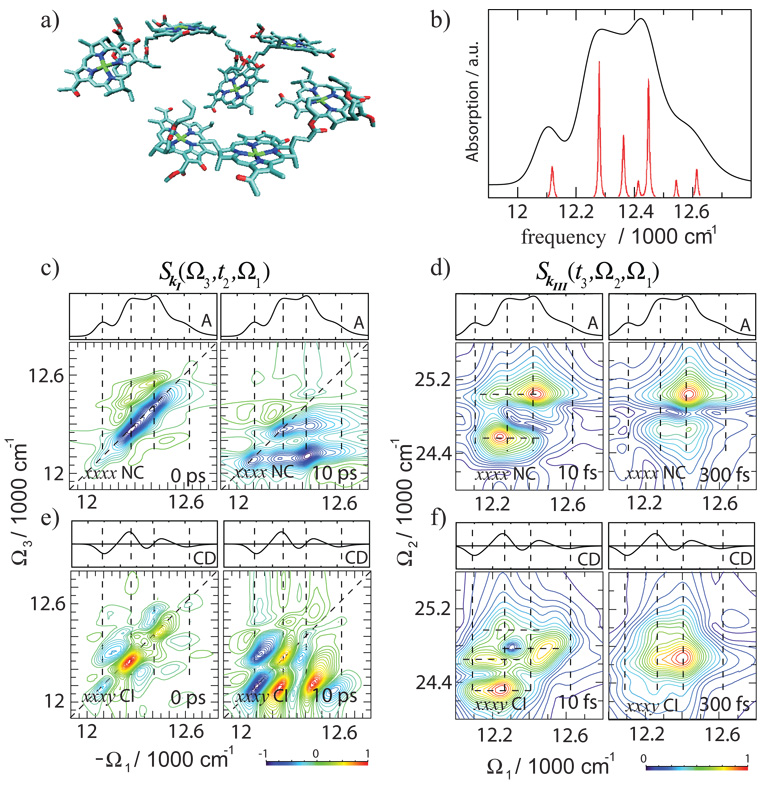
Figure 4.
2D signals of the Qy band of the FMO complex from Chlorobium tepidum. a) Arrangement of BChls in FMO, b) absorption (oscillator strength of each exciton is represented by the red line), c) and e) the 2D SkI (Ω1, t2, Ω3) using XXXX (imaginary part) and XXXY (real part) pulse polarizations. The t2 delay time is indicated on each panel. d) and f) absolute value of the 2D SkIII (Ω1,Ω2,t3) signal using XXXX and XXXY pulse polarizations. The t3 delay time is indicated on each panel.

