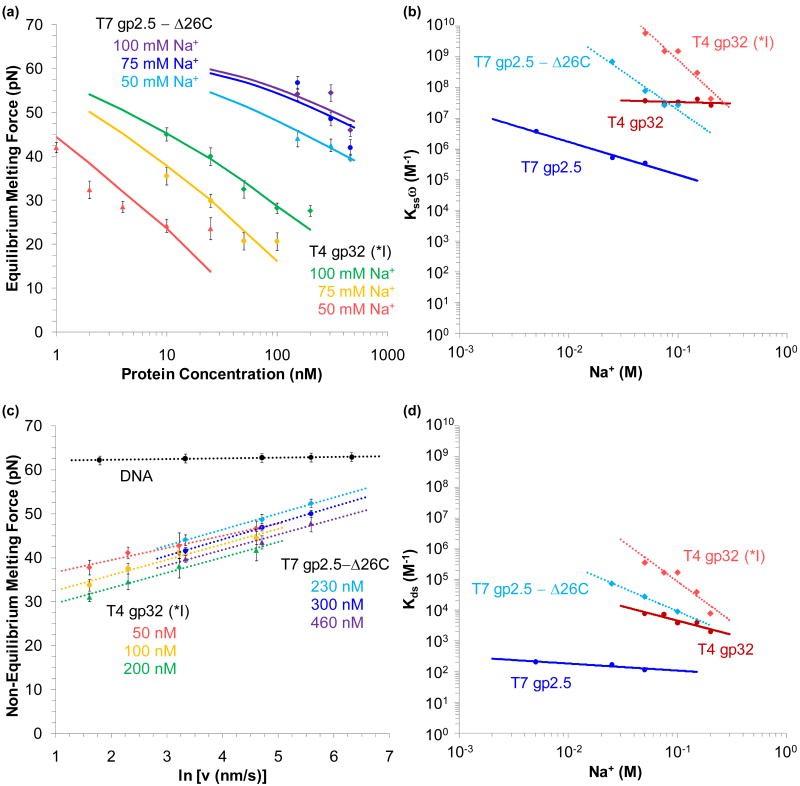
FIGURE 11.
Determining equilibrium binding to ssDNA and dsDNA for various salt concentrations. (a) Measured equilibrium melting force as a function of protein concentration in 100 mM, 75 mM and 50 mM Na+ (data points in green, yellow and red, respectively for T4 gp32 (*I) and violet, blue and cyan for T7 gp 2.5 - Δ26C). Fits shown are to Equation 11. (b) Fitted values of the equilibrium association binding constant (including cooperativity) for T7 gp2.5 (blue) and T4 gp32 (red) to ssDNA. Uncertainties are on the order of the symbols shown. (c) The melting force dependence upon the pulling rate. Selected data shows 50 nM (red), 100 nM (yellow) and 200 nM (green) of gp32 (*I) in 100 mM Na+, and 230 nM (cyan), 300 nM (blue) and 460 nM (violet) of gp2.5 – Δ26C in 50 mM Na+. DNA in the absence of protein is shown in black. Dotted lines represent fits to Equation 12. (d) Equilibrium association binding constant to dsDNA for T4 gp32 (red) and T7 gp2.5 (blue). Uncertainties are on the order of the symbols shown. Linear fits are shown as solid lines for wild type proteins and dotted lines for truncated fragments. Figures adapted from Pant, et al.44 and Shokri, et al.48

