
FIGURE 3.
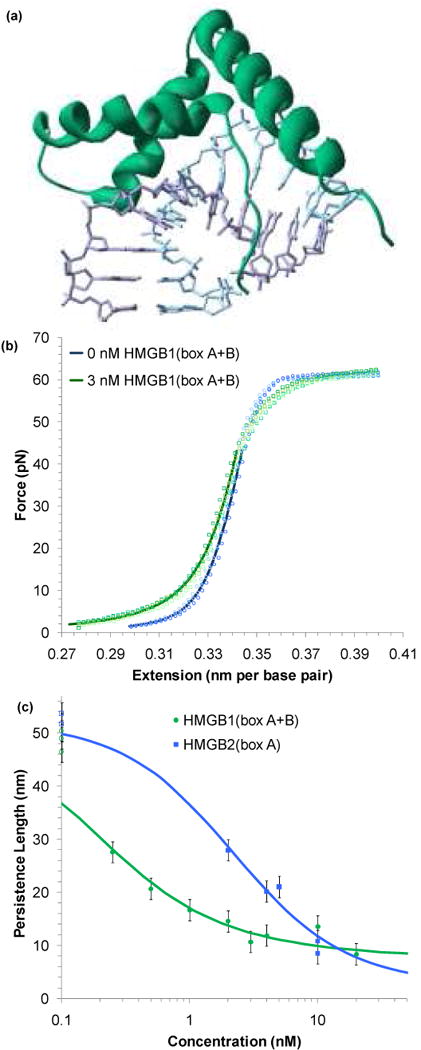
HMG proteins alter the flexibility of dsDNA. (a) Non-specific binding into the minor groove bends the backbone ∼ 111° in this crystal structure of HMG-D from D. melanogaster,89 which shows a box motif typical of the HMGB family (PDB code: 1QRV). (b) Four sets of extension data for dsDNA (blue circles) and dsDNA in the presence of 3 nM of HMGB1(box A+B) (green circles). The average of these data sets may be fit to the WLC model of Equation 1 (solid blue and green lines). The addition of protein reduces the persistence length from 46 ± 2 nm to 22 ± 2 nm. The contour length and bulk stiffness show less definite changes from bds = 0.339 ± 0.001 nm/bp and Kds = 1200 ± 50 pN to bds = 0.339 ± 0.003 nm/bp and Kds = 939 ± 100 pN for dsDNA with 3 nM HMGB1(box A+B). Fits apply only to data below 45 pN. (c) Fitted persistence lengths as a function of concentration for HMGB2(box A) (blue) and HMGB1(box A+B) (green). Uncertainties are determined from the fits to averaged data sets as shown above. The open circles along the left hand axis are the persistence lengths measured in the absence of any protein, shown as a reference. Fits to the concentration are described in the text and the data determine the equilibrium binding constant per ligand for HMGB1(box A+B) to be Kn = 5.9 ± 1.6 × 10⁸ M-1 and Kn = 0.15 ± 0.06 × 10⁸ M-1 for HMGB2(box A). Figures (b) and (c) adapted from McCauley, et al.91