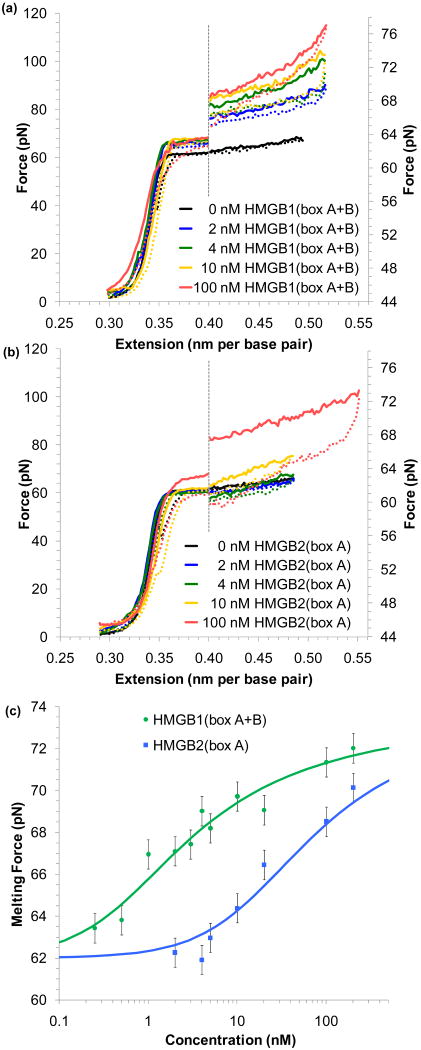
FIGURE 4.
HMG proteins stabilize DNA melting. (a) Increasing concentrations of HMGB1(box A+B) raise the force necessary to melt DNA. Extension/relaxation data are shown as solid/dotted lines. To emphasize this change, the graph is split; data to the right of the dotted line is expanded on the force axis shown to the right. (b) Increasing concentrations of HMGB2(box A) reveal little change in the melting force until much higher concentrations are added to solution. (c) The averaged midpoint of the melting force for a range of protein concentrations for HMGB1(box A+B) (green) and HMGB2(box A) (blue). Error bars are determined from standard deviations of at least four measured melting curves. Fits to the data yield an equilibrium association constant for HMGB1(box A+B) (Kn = 7.2 ± 1.7 × 10⁸ M-1) and for HMGB2(box A) (Kn = 0.28 ± 0.10 × 10⁸ M-1). Figures adapted from McCauley, et al.91

