
Fig. 2.
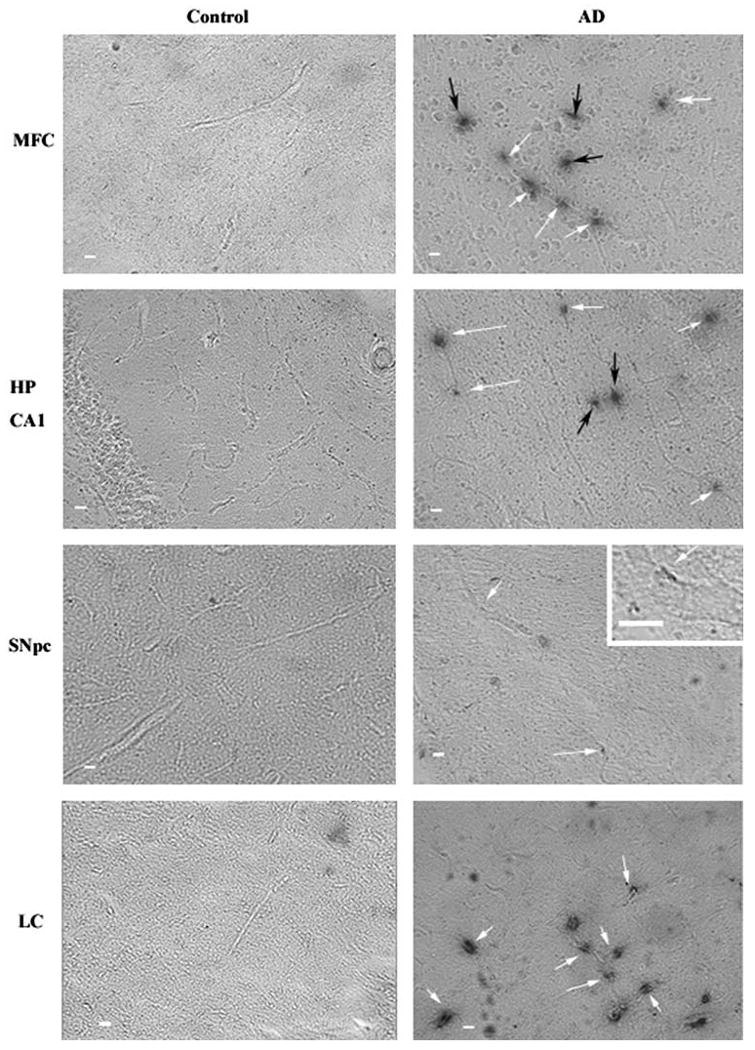
Intensity of αvβ3 staining in Alzheimer's disease tissue samples. Slices from human postmortem brain tissue were labeled with mouse anti-human integrin αvβ3 antibody and visualized with the chromagen DAB. All images are at ×5 magnification and inset images are ×25 magnification. Scale bar = 10 μm. Arrows indicate αvβ3 positive vessels in control and Alzheimer's disease (AD). Integrin αvβ3 immunoreactivity could be observed in the midfrontal cortex (MFC), hippocampus (HP CA1), SNpc and locus ceruleus (LC) of AD subjects. White arrows indicate αvβ3 staining along a longitudinal vessel. Black arrows indicate staining occurring without an apparent longitudinal vessel. While the black arrows likely indicate cross sectional vessel perpendicular to the plane of the image, they were not counted in the quantitation of vessels in Fig. 3 avoid any false positives due to edge effects around potential holes in the tissue