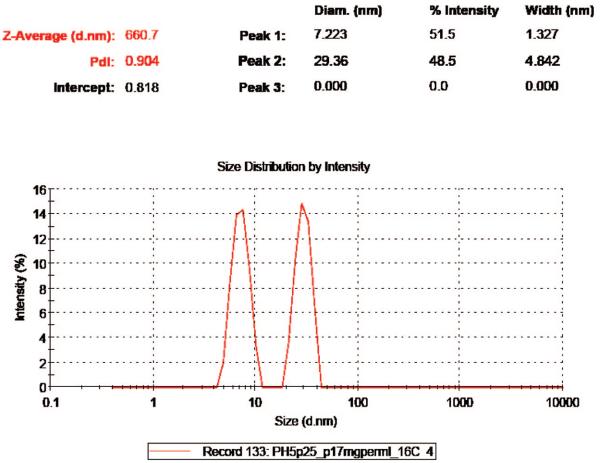
Figure 1.
An example DLS diagram during early stages of BMV capsid assembly. DLS was set for general fitting; 3 peaks were listed as default display setting, though there were only 2 components captured. The peak of ~7.22 nm represents protein dimers and the peak of 29.4 nm represents capsids. Notably, intermediates were barely observed. The diagram was recorded in 60 s at 16 °C and a concentration of 4.19 μM of protein dimers.

