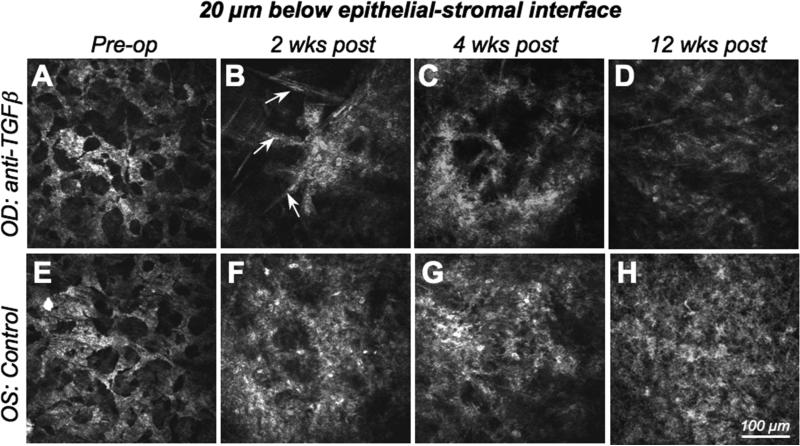
Figure 3. In vivo confocal imaging 20μm below the epithelial-stromal interface.
A-D. Images of the right eye (OD) of the cat in Fig.2, which was treated with −10D PRK and anti-TGFβ/Dexamethasone post-operatively, and demonstrating the radical change in reflectivity in this corneal region over time. E-F. Images of the left eye (OS) of the same cat, which only received vehicle solution following the −10D PRK. Images were also collected preoperatively, and then at 2, 4 and 12 weeks following PRK. Note the well-organized, regular syncitium of quiescent keratocytes pre-operatively, which contrasts with the less regular, reactive and strongly reflective activated keratocytes and myofibroblasts that replace it postoperatively, particularly in the control (left) eye. Indeed, the control eye exhibits much stronger reflectivity and cellularity than the anti-TGFβ-treated eye, especially at 2 and 4 weeks post-PRK. Note the spindle-shaped migratory fibroblasts (arrowed) and the cluster of reflective activated keratocytes in the right eye at 2 weeks post-PRK. Clustering is still present in anti-TGFβ-treated eyes 4 weeks post-PRK and is not seen in control eyes. As is evident in this set of images, control eyes exhibited greater cell density and greater reflectivity at this corneal depth than eyes treated with anti-TGFβ/Dexamethasone, at all post-operative time points.

