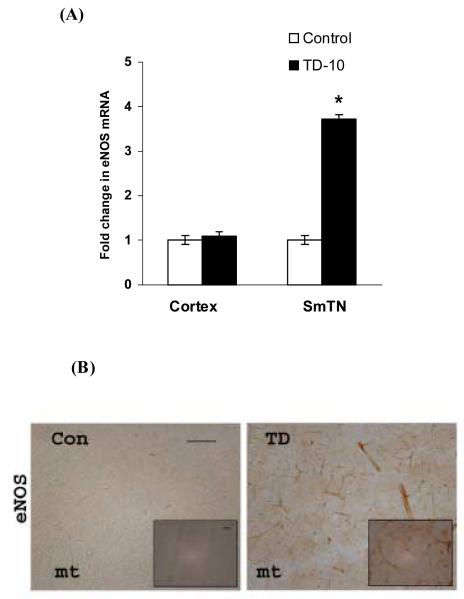
Fig. 4. TD increased mRNA and protein levels of endothelial NOS.
Quantitative RT-PCR of eNOS mRNA was performed in total RNA extracts from SmTN and cortex punches of three control or TD brains. The expression levels of mRNA were normalized relative to the levels of GAPDH mRNA and fold differences were calculated relative to the control group. Values are mean ± SEM in each group. * p <0.05 compared with control group (n=3) (A). Values are mean ± SEM in each group. * p <0.05 compared with control group (n=3). Although the statistics were done with n’s of three, the results reflect a total of nine animals in each group. Panel (B) shows the representative control and TD brains sections stained with an eNOS antibody. TD-10 brains showed increased eNOS immunoreactivity (n=4). Scale bars: 100 μm; Insets 20 μm.

