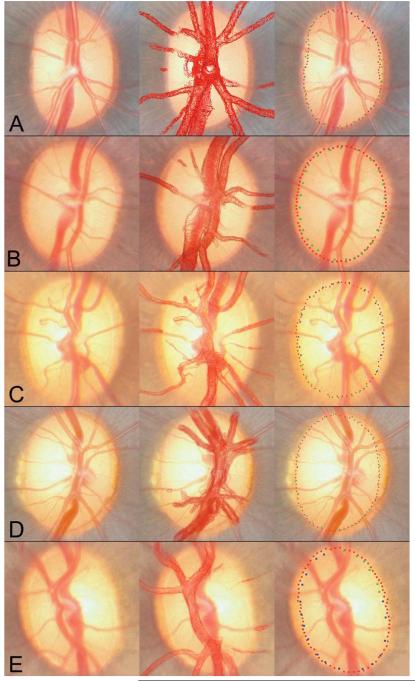
Figure 6. Five examples (A-E) of good alignment between BMO points and the clinical disc margin, following ‘first pass’ co-localization.
Clinical images are shown in the left panels. The co-localizations of the vessel reconstructions to the clinical images are shown in the middle panels. The co-localized BMO points (red glyphs) and the clinical disc margin delineations (blue and green glyphs) are shown in the right panels

