
Figure 2.
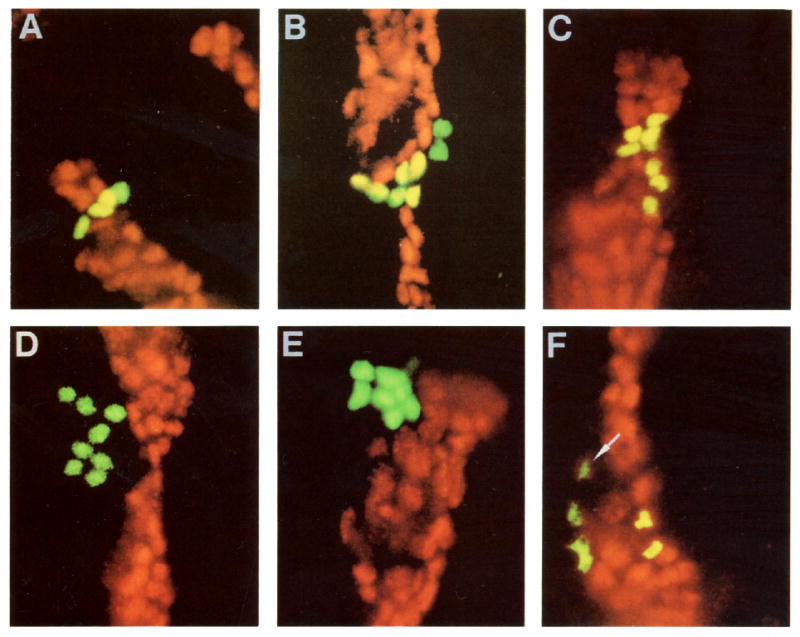
Mapping Clone Territories with Respect to engrailed Expression
Double exposures showing a marked clone in green and engrailed in red. Coincidence of the two fluorescent signals is seen as yellow. Various types of clones are shown: two “mixed clones” (A and B), two clones of engrailed-expressing cells (C and F), and two nonexpressing clones (D and E). In (A), the embryo was fixed between the second and third postblastoderm divisions (stage 10) and, as expected, the marked clone comprises 4 cells. In (B)–(F), embryos were fixed soon after the third postblastoderm division (stage 11). Notice, in (F), the weaker engrailed-expressing cell at the anterior border of the stripe. The outer edge of the green signal (the clonal marker) was truncated to allow the weak red (engrailed) signal to be seen. Only 6 of the 8 cells of this clone are visible; the remaining two were in a different plane of focus. In this and subsequent figures, posterior is to the right and dorsal is up.