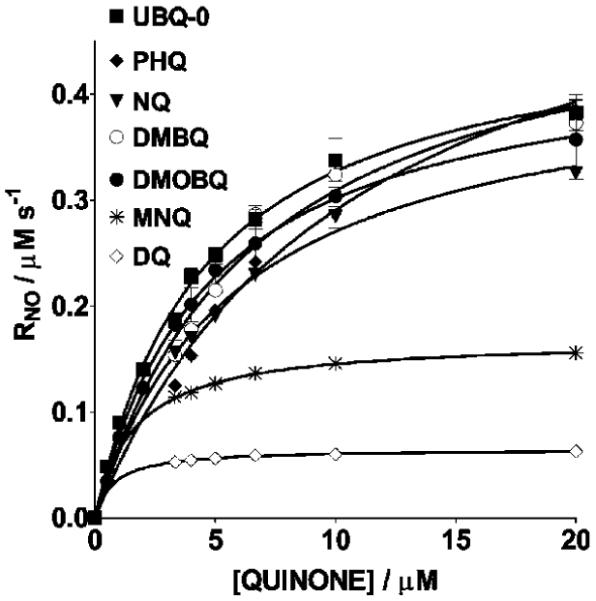
Figure 3.

Michael-Menten plots used to determine Vmax and Km for the X/XO reduction of NO in the presence of quinones. Samples were N2-saturated solutions containing 20 μM NO, 10 mU XO/mL, 50 μM X, and 50 mM phosphate buffer (pH 7.4) and in the presence of 3.33-20 μM quinone. The temperature is 37 °C. Initial rates of NO consumption used were those obtained after subtracting the basal initial rate, that is, in the absence of quinone, (6.2 ± 0.3) × 10-8 M/s’ from the measured initial rate. Error bars are standard errors of the mean value of at least three determinations.
