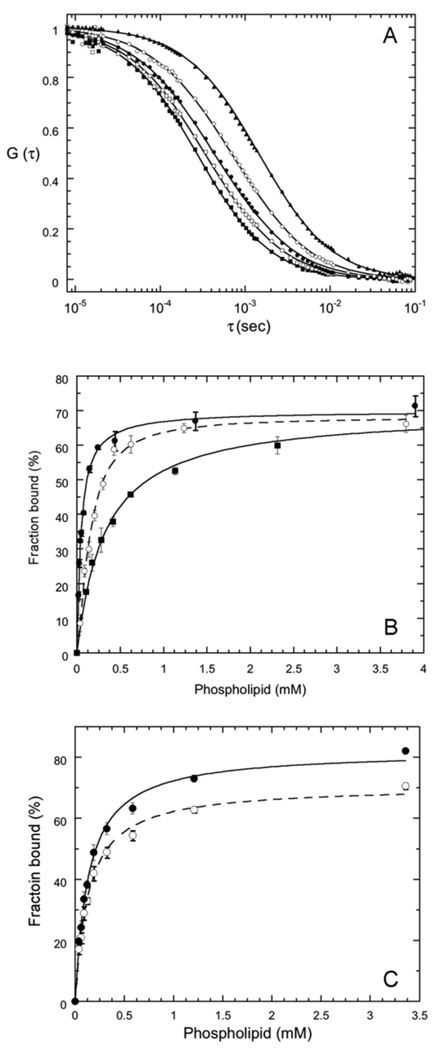
Figure 2.
(A) Crosscorrelation curves for free *Y88A (■), rhodamine-labeled PC SUVs (▲), and for 3.5 nM *Y88A binding to SUVs in the presence of 0.1 mM (❒), 0.4 mM (●) and 4.7 mM (❍) phospholipid, corresponding to 18%, 36% and 70% bound protein. The line through these data is the best fit to Equation 1 with Dbound =15 µm2/s. (B) Titration curves for *Y88A binding to pure PC (■), PC/PG (7:3) (●), and PC/PG (1:1) SUVs (❍). The lines through the data represent the best fits to equation 2. Error bars represent the standard deviations from three time points for the same titration. (C) Dependence of the fraction bound on the method used to fit equation 1. The fraction bound shown are for *Y88A and XPC = 0.9 either globally fitting Dbound (●) (resulting in Dbound=17 µm2/s) or fixing Dboundto 15 µm2/s (❍). The lines are hyperbolic (n=1) fits to equation 2.

