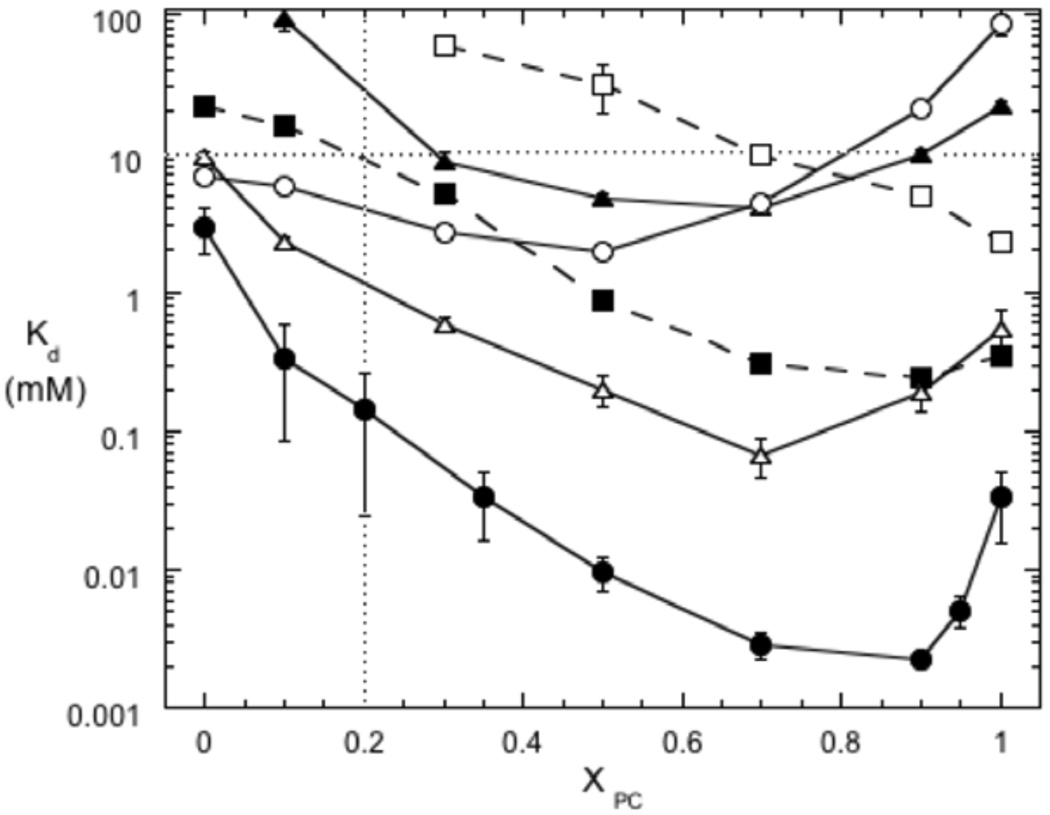
Figure 3.
Binding of PI-PLC variants to PG/PC SUVs as a function of XPC. The apparent Kd values were measured by FCS for variants labeled with AF488 at N168C: *N168C (●), *P42G (▲), *K44A (■), *K44E (❒), *Y88A ( ), and *3YS (❍). The two dotted lines indicate XPC = 0.2 and 10 mM total phospholipids. The error bars are the standard deviations of Kd from two independent protein and SUV preparations.

