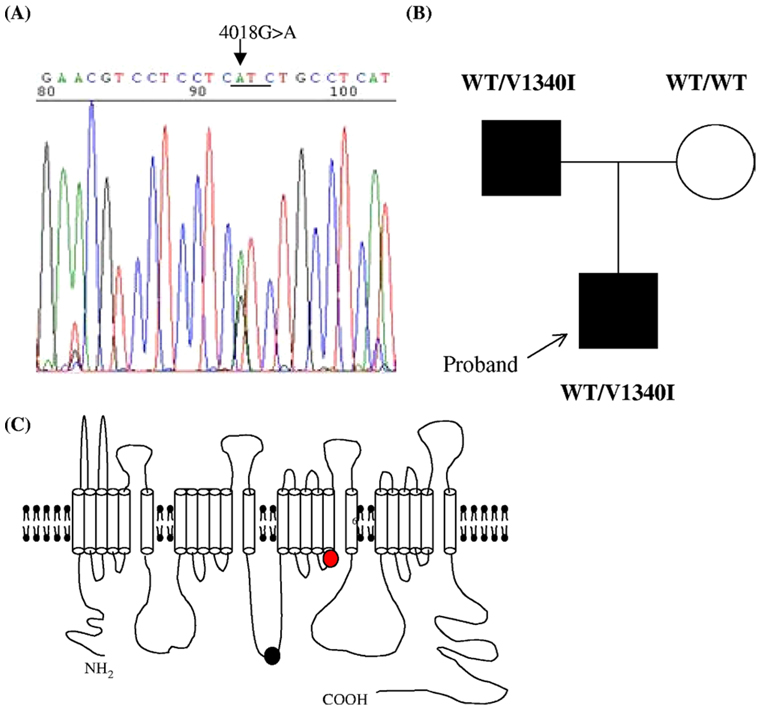
Figure 2.
Genetic analysis. (A) DNA sequence analysis shows a G to A nucleotide change in SCN5A, resulting in the amino acid substitution V1340I. (B) Family pedigree. The black filled square indicates the career of V1340I. (C) A schematic illustration of sodium channel topology. The red circle indicates the relative position of the V1340I mutation in the S5 of the domain III. The black circle indicates the position of Q1077.

