Figure 4.
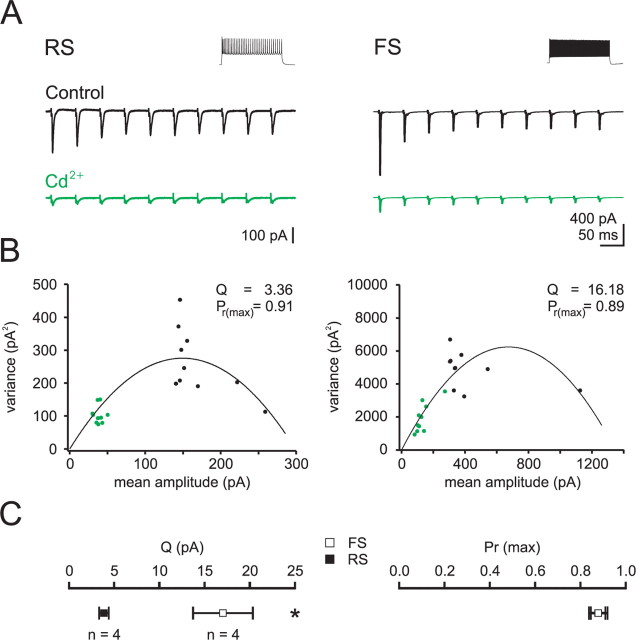
Larger quantal amplitude but similar release probability of TC inputs onto FS as compared to RS cells. A, EPSCs recorded in RS (left) and FS (right) cells voltage clamped at EIPSC in response to repetitive bulk stimulation of TC afferents (20 Hz) under control conditions (black) and in the presence of cadmium (30 μm, green). Insets show response to an 800 ms step depolarization in current clamp. B, The mean amplitude of each EPSC in the train is plotted against its respective variance (measured at the peak of the EPSC). Black and green data points represent EPSCs recorded in control and cadmium, respectively. The data are fit with a parabolic function based on a multinomial model (see Materials and Methods). C, Summary data: note that while the quantal amplitude (Q) is 4.4-fold larger in FS as compared to RS cells, the probability of release (Pr) is similar.

