
Figure 5.
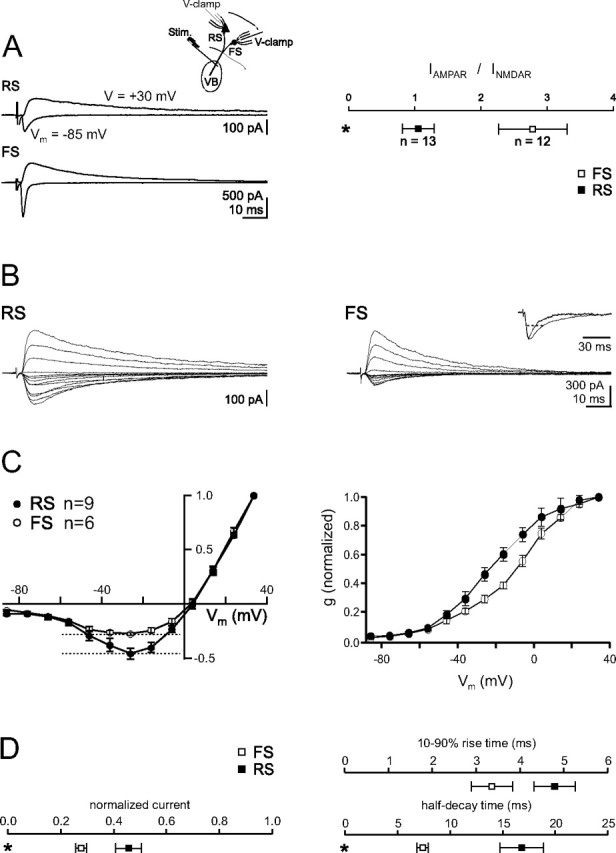
Distinct properties of NMDAR-mediated EPSCs evoked by TC afferents onto RS and FS cells. A, Left, EPSCs elicited by bulk stimulation of TC afferents and recorded simultaneously in a voltage-clamped RS cell (top) and FS cell (bottom). The outward, pharmacologically isolated NMDAR-mediated EPSC was recorded +30 mV above the reversal potential in the presence of the AMPAR antagonist NBQX (10 μm) and the GABAAR antagonist gabazine (10 μm). The inward, AMPAR-mediated EPSC was isolated by digital subtraction of the EPSC recorded at −85 mV (EIPSC) in the presence of NBQX and gabazine from the EPSC recorded at the same potential in control conditions. Right, Summary data of the ratio between the peak amplitudes of the AMPAR- and NMDAR-mediated EPSCs, isolated as described above. Note the larger AMPAR–NMDAR ratio of EPSCs recorded in FS cells. B, Current–voltage relationship of NMDAR-mediated EPSCs elicited by stimulation of TC afferents and recorded in RS cells (left) or FS cells (right) in the presence of NBQX and gabazine. Membrane potentials (corrected for liquid junction potential) were varied between −86 and +34 mV. Currents are scaled to the peak of the EPSC recorded at +34 mV for comparison. Note that NMDAR-mediated EPSCs recorded at negative potentials are relatively larger in RS as compared to FS cells. Inset, Superimposed peak-scaled NMDAR-mediated EPSC recorded in FS and RS cells at −26 mV. Note the faster time course of the EPSC recorded in FS cells. Dotted line, Half-decay time. C, Summary data. Normalized current–voltage relationship (left) and normalized conductance–voltage relationship (right) of NMDAR-mediated EPSCs recorded in FS and RS cells. Note the rightward shift of the conductance–voltage relationship in FS as compared to RS cells. D, Summary data for normalized peak amplitude at −26 mV, rise times, and half-decay times of the NMDAR-mediated EPSCs recorded in FS and RS cells.