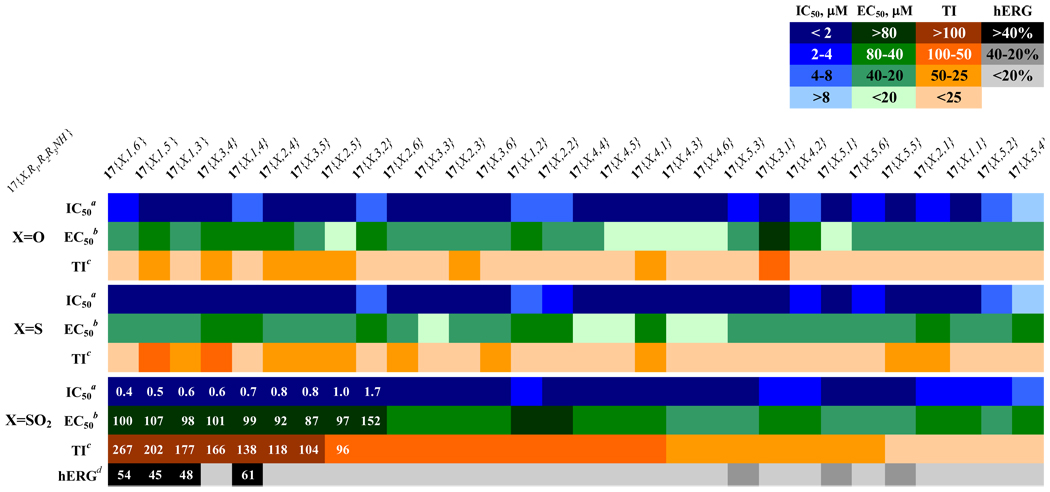
Figure 8.
Activity summary of the second generation compounds sorted by therapeutic index (TI): Heatmap shows inhibitory constants for inhibition of interaction of coregulatory peptide SRC2-2 and TRβ (IC50), HepG2 proliferation inhibition (EC50), and calculated therapeutic index (ratio of two prior values).aValues are the mean of three independent experiments in triplicate. bValues are means of two independent experiments in triplicate. cValues are EC50 over IC50. dValues are the mean of two independent experiments in quadruplicate.

