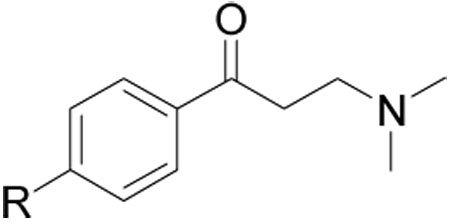
Table 5.
Summary the Activities of Hydrophobic Side Chain Modified β-Aminophenylketones
 | ||||
|---|---|---|---|---|
| Compound Number | R | SRC Binding Inhibition, TRβ (IC50, µM)a | Cell viability HepG 2 (EC50, µM) b | hERG inhibition (% terfenadine effect)c |
| 1 | 9.6±1.1 | 54±9 | 68±12 | |
| 9 | 16.5±1.5 | 65±19 | 61±9 | |
| 16{1} | >50 | >100 | 3±1 | |
| 16{2} | >50 | >100 | 16±10 | |
| 16{3} |  |
>50 | >100 | 35±10 |
| 16{4} | 5.9±0.6 | 34±15 | 48±4 | |
| 16{5} | 4.9±0.7 | >100 | 36±9 | |
| 16{6} | 8.1±1.4 | >100 | 15±7 | |
| 16{7} | 12.4±3.2 | >100 | 38±7 | |
| 16{8} | >50 | >100 | 15±20 | |
| 16{9} | >50 | >100 | 23±15 | |
Values are the mean of three independent experiments in triplicate.
Values are means of two independent experiments in triplicate. The general error limits are ±5%.
Values are the mean of two independent experiments in quadruplicate.
