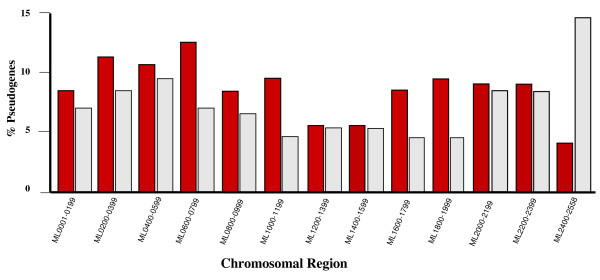
Figure 1.
Distribution of transcribed pseudogenes within specific regions of the M. leprae chromosome. This graph represents the distribution of transcribed pseudogenes as a percent of the total number of pseudogenes within each specific region of the M. leprae chromosome (red) and the distribution of pseudogenes within each specific region of the M. leprae chromosome as a percent of the total number of pseudogenes within the genome (gray). http://www.sanger.ac.uk/Projects/M_leprae/.

