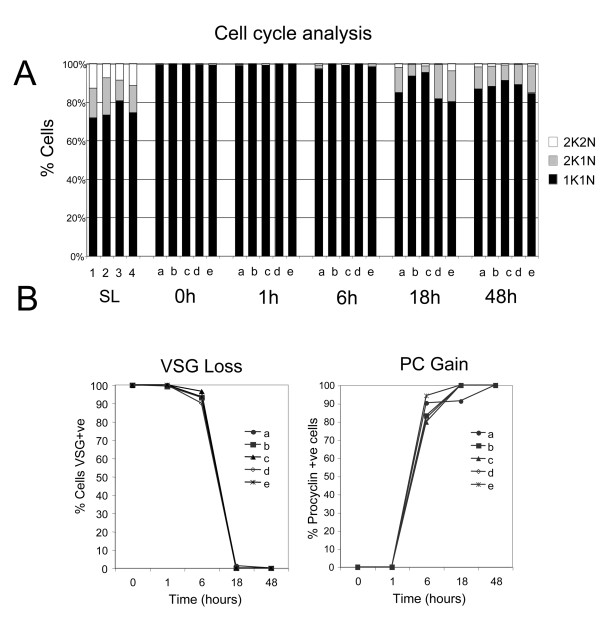
Figure 2.
Cell cycle and surface antigen analysis during differentiation. A. Analysis of the percentage of cells in different cell-cycle phases (1 kinetoplast, 1 nucleus, Black; 2 kinetoplasts, 1 nucleus, grey; 2 kinetoplasts, 2 nuclei, white) from each of the bio-replicates and time points considered in this analysis. Most notably, the stumpy population is uniformly arrested in G1/G0 and cells progressing back into a proliferative cell-cycle begin to appear between 6-18 h after the initiation of differentiation. B. Expression of the bloodstream-stage specific variant surface glycoprotein (VSG) coat and EP procyclin (PC) coat on each of the bio-replicates and time points evaluated in this analysis. Samples were scored by immuofluorescence staining for the expression of each antigen. EP procyclin was weakly detectable at 1 h, but strongly expressed within 6 h.

