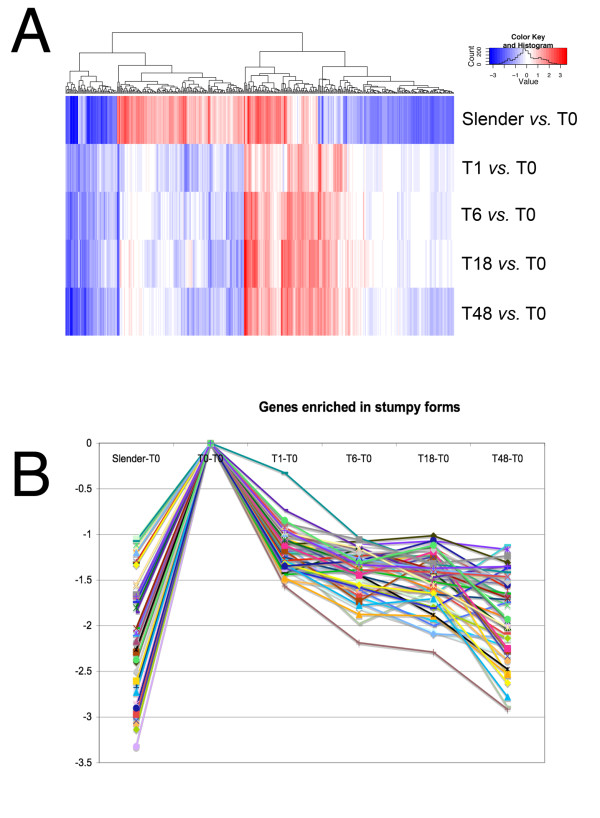
Figure 4.
Expression profiles of genes at different time points in the analysis. A. Heatmap of expression differences of all samples relative to stumpy samples (T = 0). The genes included were significant at the p < 0.001 level in one or more contrasts. The logFC values have been heatmapped, with blue representing down-regulation and red representing up-regulation. Genes are along the x-axis and comparisons are represented along the y-axis, with gene profiles being clustered by Euclidian distance, their relatedness being shown in the dendogram above the heatmap. B. Expression profile of genes identified as being enriched in stumpy forms. The genes shown are those identified in the trinary groups (-1,-1,-1,-1,-1) and (0,-1,-1,-1,-1). The y axis represents the LC fold change, the X-axis is the time point during the differentiation programme.

