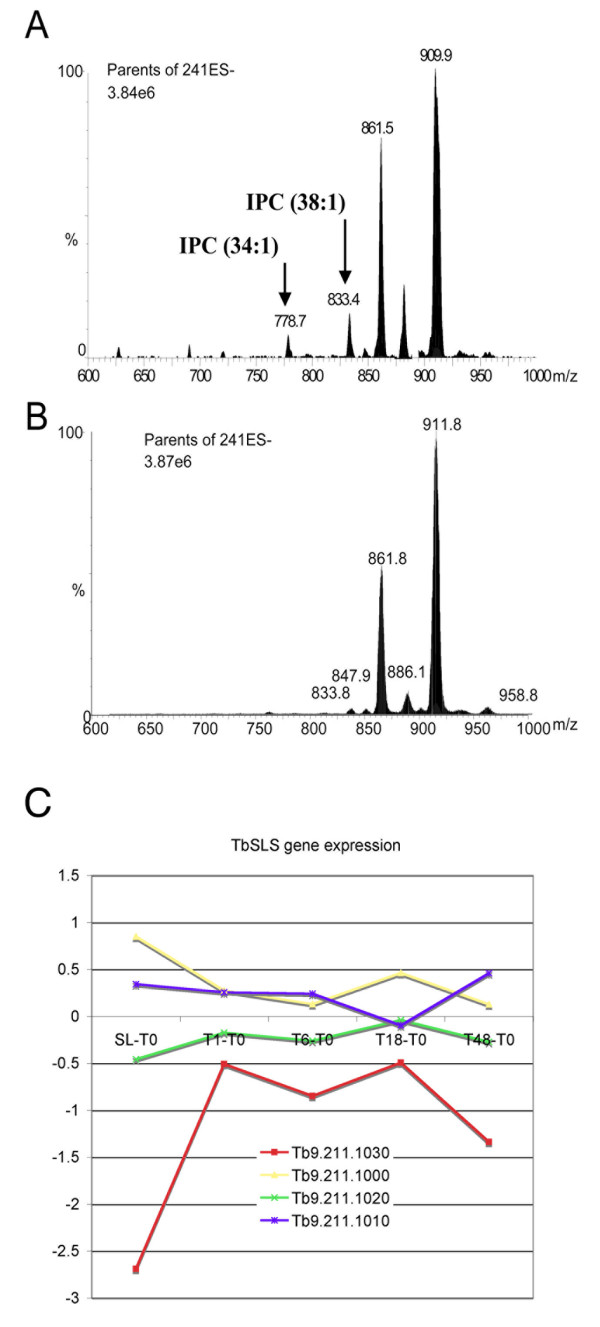
Figure 6.
IPC expression in different life cycle stages. Lipids extracted from stumpy (Panel A) and monomorphic slender (Panel B) T.brucei, were analyzed by ES-MS/MS for GPIno phospholipids by parent-ion scanning of the m/z 241 as described in experimental procedures. Peak assignments are based on MS/MS daughter ion spectra and comparisons to previous experiments on whole cell extracts. Panel C shows the relative expression of each member of the TbSLS gene family (TbSLS1, Tb9.211.1030; TbSLS2, Tb9.211.1020; TbSLS3, Tb9.211.1010; TbSLS4, Tb9.211.1000) during the differentiation between slender and stumpy forms and at each point during differentiation from stumpy to procyclic forms. TbSLS1 is significantly up-regulated during these transitions.

