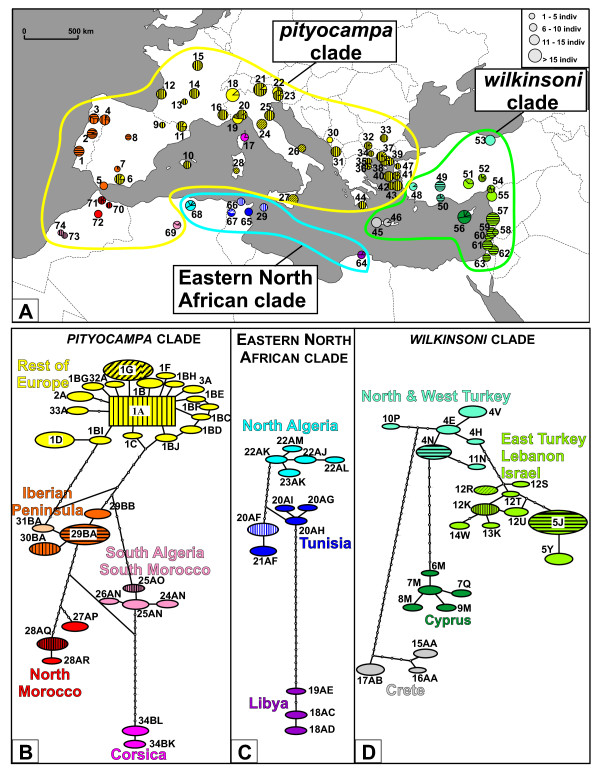
Figure 3.
Geographical distribution of mitochondrial haplotypes of the Thaumetopoea pityocampa/T. wilkinsoni complex, and within-clade haplotype networks. A. Geographical mapping of haplotypes in the sampled populations. Circles are proportional to the number of individuals analyzed in each population and colors refer to the major clades identified in network analyses. Codes of populations are given in Additional file 1. B. Haplotype network of the 'pityocampa' clade. Each line in the network represents a single mutational change. Empty circles indicate intermediate, missing haplotypes. C. Haplotype network of the 'Eastern North Africa' clade. D. Haplotype network of the 'wilkinsoni' clade.

