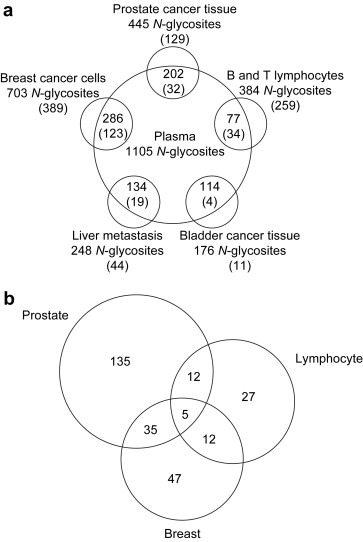
Figure 2.

Schematic diagram of analysis of N‐glycosites from tissues/cells and plasma. Cell surface proteins and secreted proteins from tissues/cells and plasma are processed using glycopeptide capture method, glyco‐peptides are analyzed by mass spectrometry and identified by SEQUEST search. The identified peptides and proteins from tissues/cells and plasma are compared and the tissue/cell specific proteins are identified. Figure was adapted from Zhang et al. (2007).
