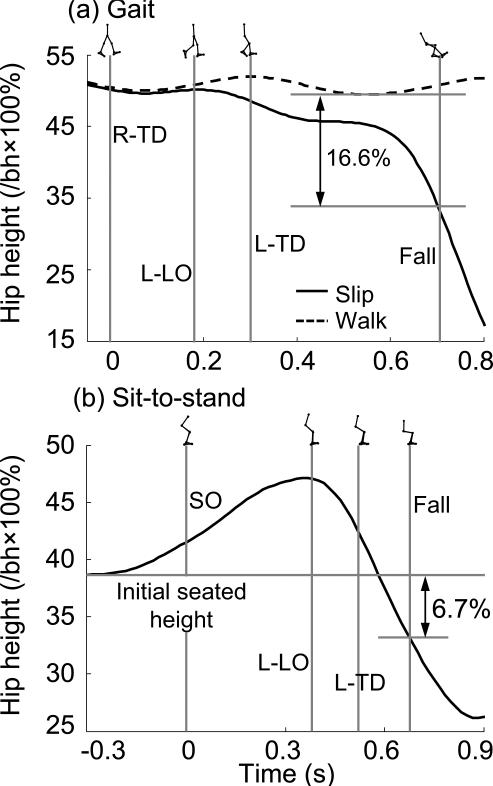
Fig. 2.
Typical plots of the time history of mid-hip point height during (a) gait-slip and (b) sit-to-stand-slip. Also shown are the events of interest (vertical lines). They include slipping (right) limb touchdown (R-TD) in gait and seat-off (SO) in sit-to-stand, recovery step liftoff (L-LO) and touchdown (L-TD). The actual fall time, which is identified as the instant when the fall-arrest force exerted on the load cell exceeds 30% body weight, is also marked as a vertical line. Horizontal lines illustrate the values of hip descent at the actual fall time.

