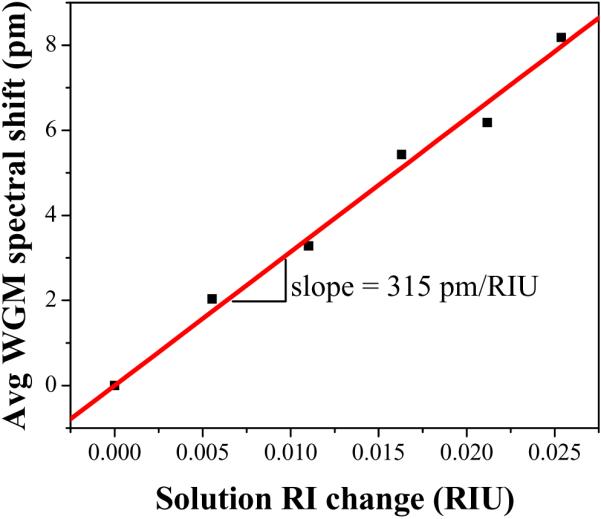
Figure 11.

The measured refractive index sensitivity for an exemplary LCORR. Data is recorded for ethanol solutions of 10%, 20%, 30%, 40%, and 50%. The values are the result of an average across at least 6 observed WGM shifts. The slope of the linear fit is the refractive index sensitivity.
