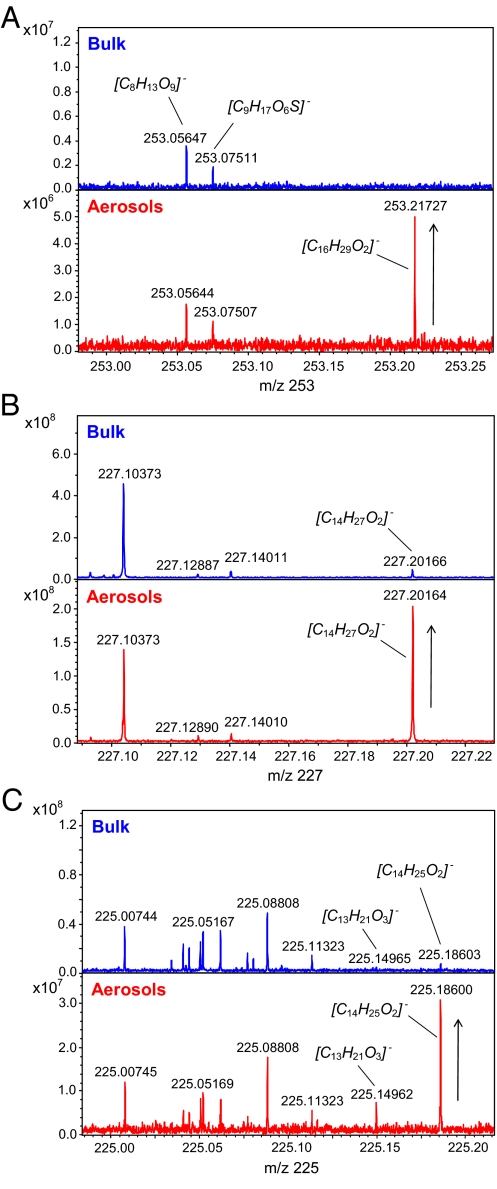
Fig. 4.
Comparison of both bulk and aerosois mass spectra within three distinct mass windows. (A) Representative increase in peak intensity of mass 253.2172, assigned to [C16H29O2]−, relative to other signals in nominal mass 253. (B) Representative increase in peak intensity of mass 227.2016, assigned to [C14H27O2]−, relative to other signals in nominal mass 227. (C) Representative increase in peak intensity of masses 225.1496 and 225.1860, assigned respectively to [C13H21O3]− and [C14H25O2]−, relative to other signals in nominal mass 225.

