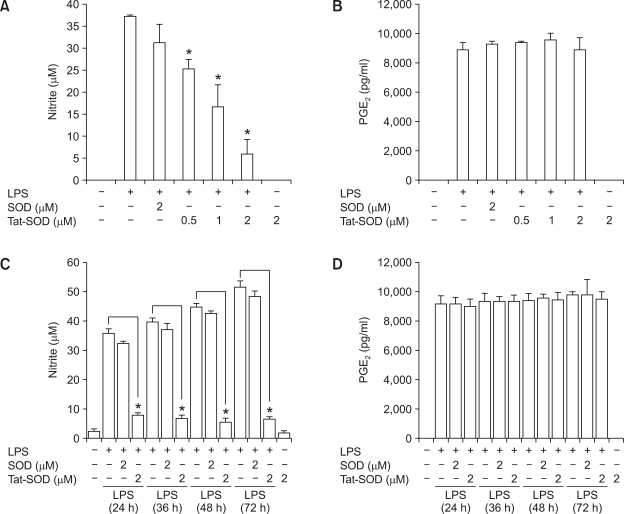
Figure 3.
Effects of SOD fusion proteins on production of NO and PGE2 in LPS-stimulated RAW 264.7 cells. RAW 264.7 cells were stimulated with LPS (100 ng/ml) for 18 h (A, B), 24 h, 36 h, 48 h and 72 h (C, D) with or without pretreatment with Tat-SOD or SOD fusion proteins for 1 h. Culture medium of RAW 264.7 cells was harvested. The levels of NO (A, C) and PGE2 (B, D) in the culture medium were determined using a spectrophotometric method based on the Griess reactions and an ELISA kit, respectively. The data are the mean ± SEM of three separate experiments. *P < 0.001 compared with cell treated with LPS alone.

