
Figure 5. 2DOS time series.
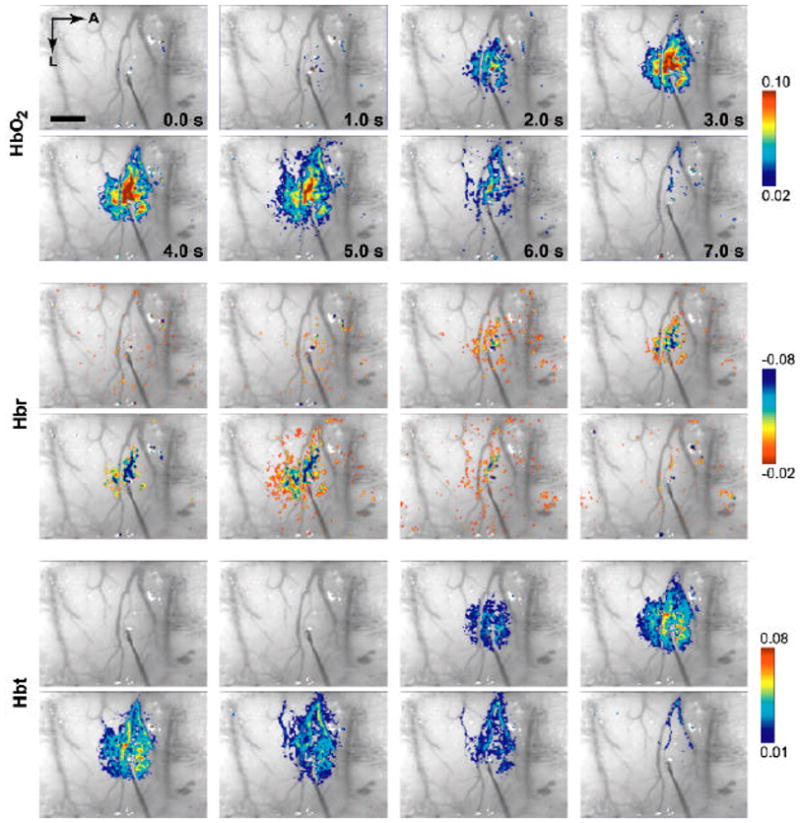
Applying a spectral analysis to multi-wavelength optical imaging data produced 2D images of functional changes in HbO2, Hbt, and Hbr (2DOS). A representative example is shown here at several time points, overlaid on raw structural images taken at 605 nm. Hemodynamic responses originated from a common focus and subsequently evolved through vascular compartments. A, anterior; L, lateral. Scale bar, 1 mm.