
Figure 2.
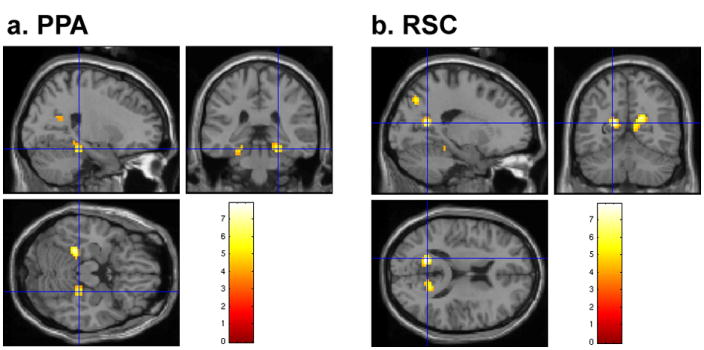
The PPA and RSC are shown on a representative participant’s brain. a, The crosshair indicates the right PPA (24, -33, -23). b, The crosshair indicates left RSC (-18, -59, 13).
Official websites use .gov
A
.gov website belongs to an official
government organization in the United States.
Secure .gov websites use HTTPS
A lock (
) or https:// means you've safely
connected to the .gov website. Share sensitive
information only on official, secure websites.
The PPA and RSC are shown on a representative participant’s brain. a, The crosshair indicates the right PPA (24, -33, -23). b, The crosshair indicates left RSC (-18, -59, 13).