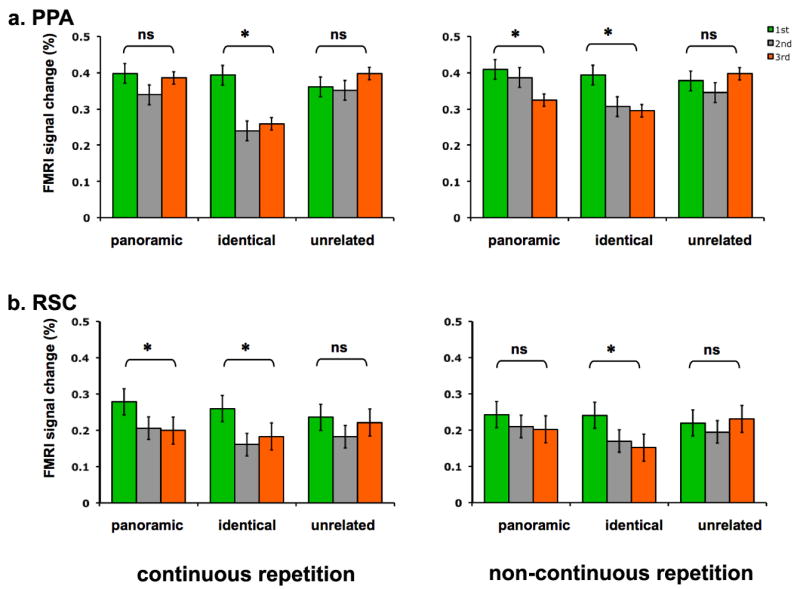
Figure 5.

Mean peak hemodynamic responses for panoramic 1st, 2nd, 3rd; identical 1st, 2nd, 3rd; unrelated 1st, 2nd, 3rd images are shown separately for the continuous repetition block (left panel) and the non-continuous repetition block (right panel) in Experiment 2. Error bars indicate ± SEM. a, Parahippocampal place area (PPA). b, Retrosplenial cortex (RSC).
