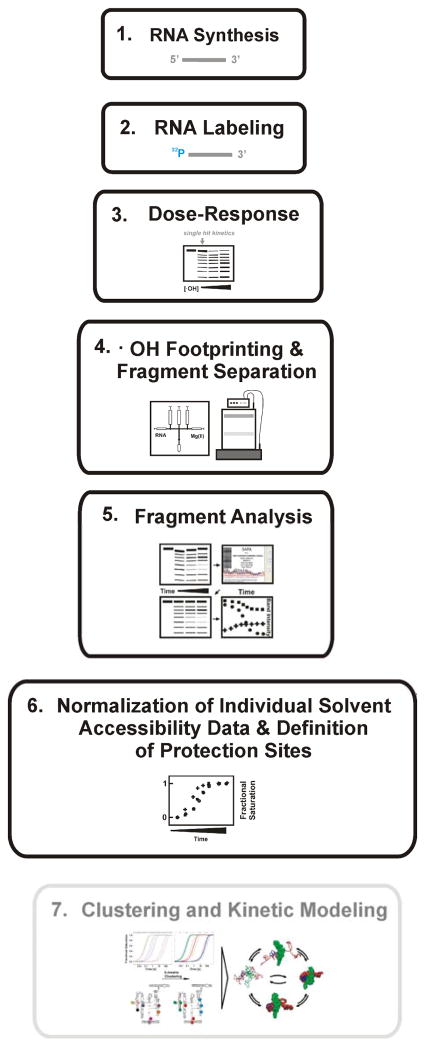
Figure 1.
A schematic diagram illustrating the general procedure for conducting time –resolved rapid - reaction •OH footprinting studies. In our example steps 1 – 6 were performed. The grey box indicates an additional tool for the development of ‘structural – kinetic’ models of complex folding reactions. The individual steps are explained in detail in the text and in recently published protocols [23, 25].

