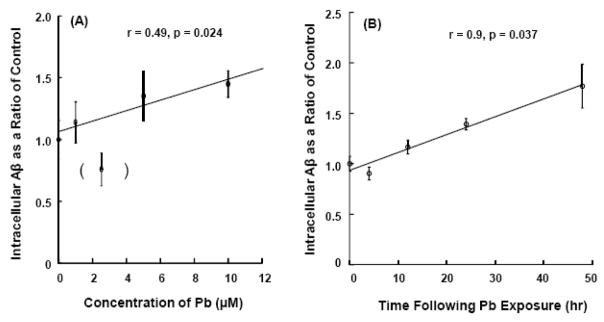
Fig. 3.
Increases in accumulation of intracellular Aβ in Z310 cells following Pb exposure as quantified by ELISA. (A). Dose-response study. Cells were treated with Pb at the concentrations indicated for 24 hr. The cells were harvested and homogenates used for ELSIA. The value in parenthesis was excluded from the linear regression analysis. (B). Time-course study. Cells were treated with 10 μM for 4–24 h, followed by ELISA. Data represent mean ± SD, n = 4–6 wells per group. *: p<0.05.

