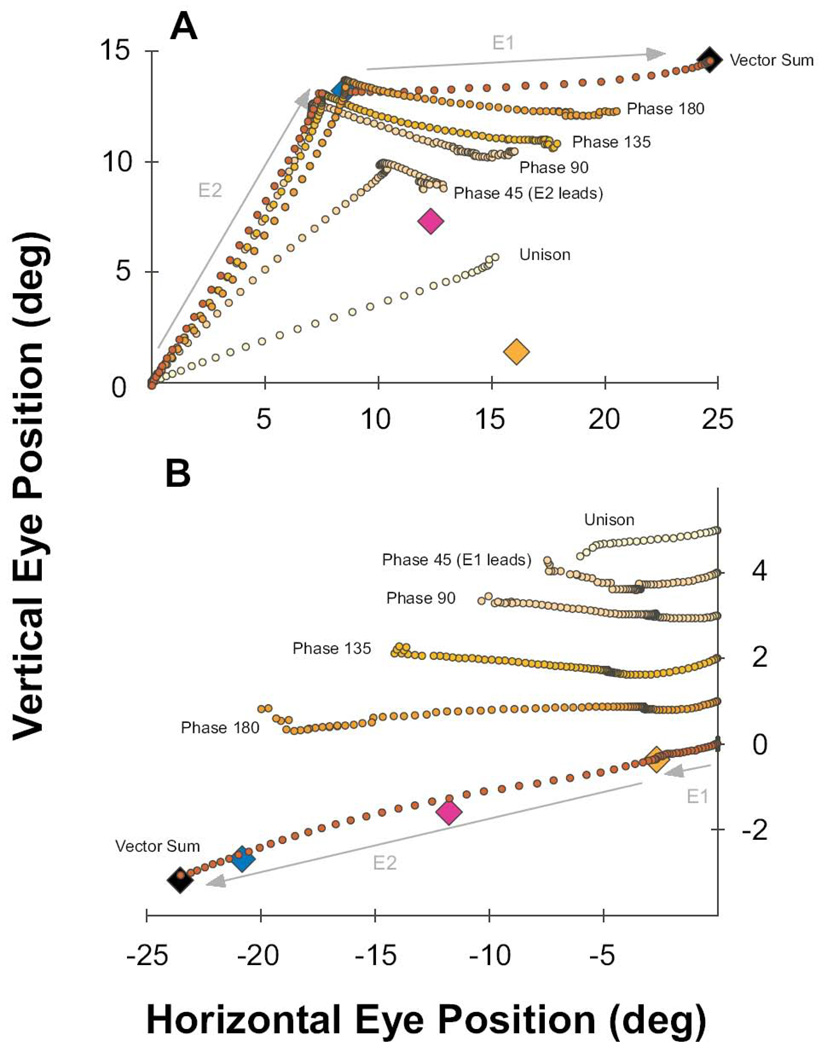
Figure 10. Progression of Dynamic Eye Trajectory as a Function of Phase Between Stimulation Sites.
Orange and blue diamonds indicate the end point of saccades generated by stimulation of sites E1 and E2 , respectively. Pink and black diamonds, respectively, represent the vector average and vector sum locations. A) Mean trajectories for all phase conditions in which E2 leads E1 for a typical iso-amplitude case (upward movement followed by horizontal). The unison condition produced a straight line trajectory to an end point near the vector average of the E2 and E1 vectors. The phase 45 condition (25 ms delay) is initially dominated by movement toward E2, then curves dynamically through a trajectory not represented by either stimulation site or the unison activation. The movement ends at a point near the vector mean despite persistence of the stimulation at both sites. Overlaid plots of the Phase 90 to Phase 180 movements demonstrate the progression of dynamic trajectories where movement from E2 stimulation completes before the influence of E1 manifests, with greater separation in time between stimulation sites (50, 75, 100, >>100 ms). B) Same as in panel A for a typical iso-direction example with E1 leading E2 (small movement followed by large). Plots are offset vertically for ease of viewing. Similar to the iso-amplitude case in A, the unison condition induced a single, straight movement to an endpoint near the vector average. The phase 45 to 180 conditions shows some stretching of the size of the E1 movements by collision with the E2 stimulation, with progressively complete and fast expression of the large E2 movement at longer phase delays (25 to >>100 ms). For both A and B, some plotting discontinuities occur near the ends of each average plot due to drop out of shorter individual trials in time.

