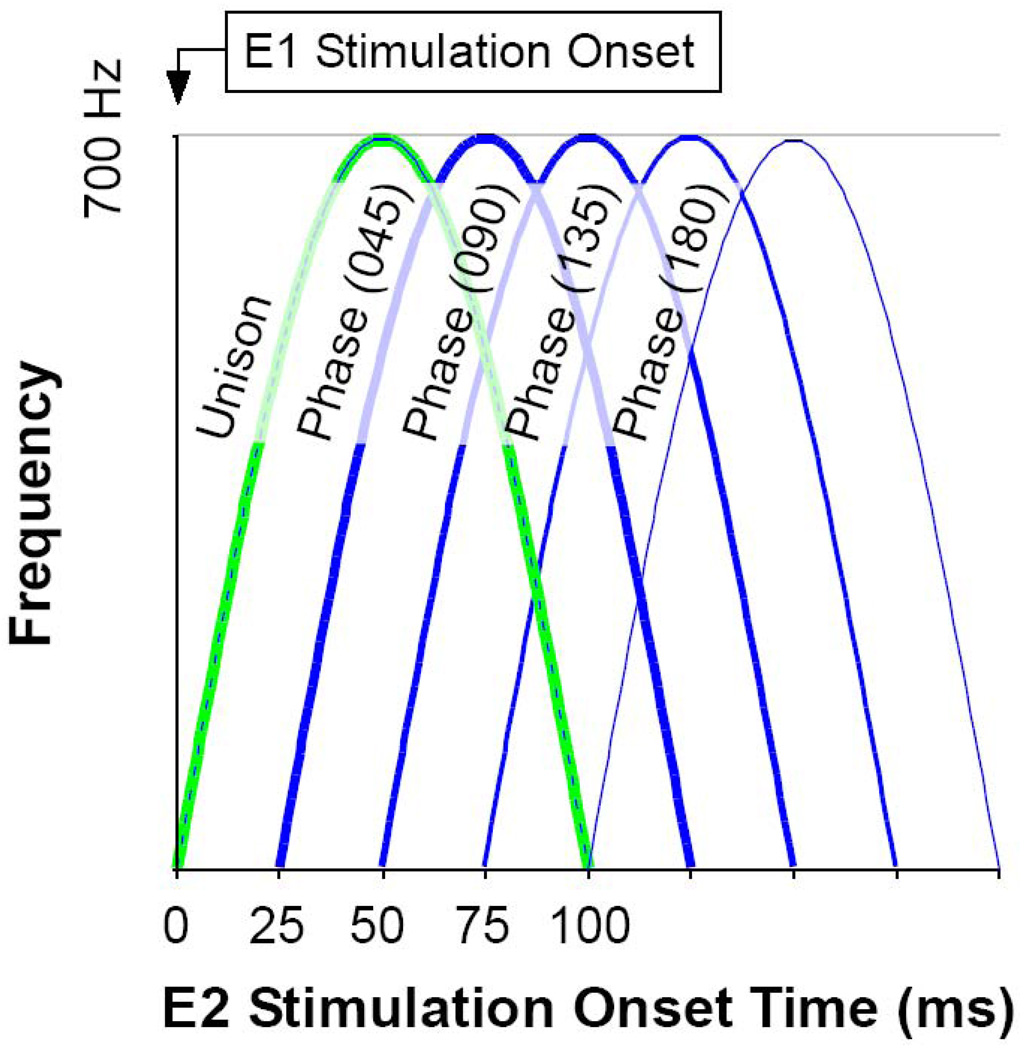
Figure 2. Experimental Design.
A) Diagram of the shifting phases of stimulation pairs used to evoke saccades. This example shows the most commonly used set of time shifts. The timing of the stimulation train E2 is plotted with respect to the stimulation train E1. Beginning with time 0 (Unison), E2 shifted in 25ms increments until the stimulation was sequential (Phase 180). A similar sequence was employed with E2 leading E1. Order of presentation was randomized.

