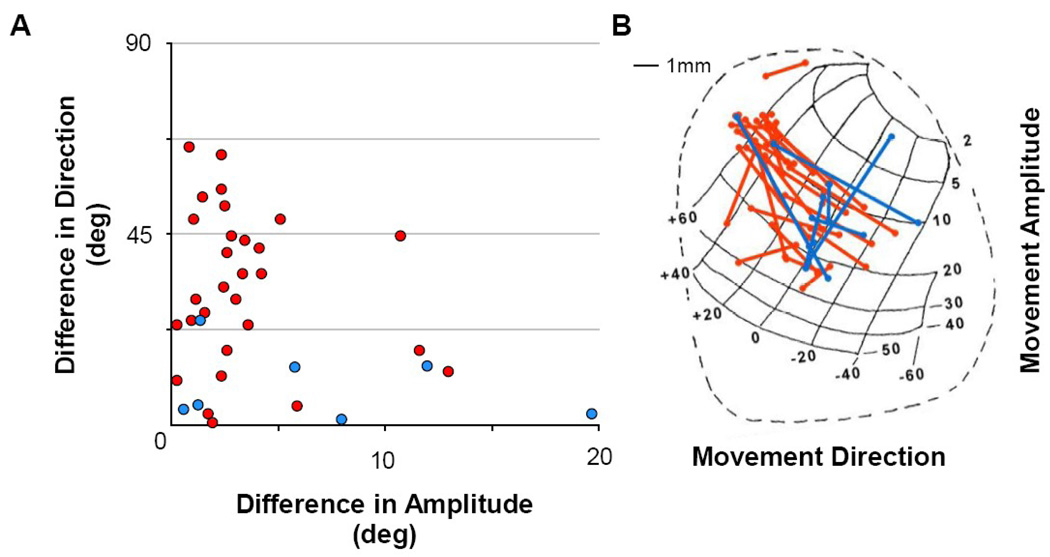
Figure 3. Metrics of Movements.
A) Difference between movement directions and amplitudes from pairs of individual sites within the SC motor map. Iso-direction and iso-amplitude movements are located at the top left and bottom right of the graph, respectively. B) Illustration of the standard anatomical and topographic map of the Superior Colliculus (from Robinson, 1972). Stimulation occurred in the left SC of monkey MA and from the right SC in monkey SA, but here are overlapped on a single map for ease of viewing. Red and blues traces in both panels represent pairs of stimulation sites in monkey MA and monkey SA, respectively.

