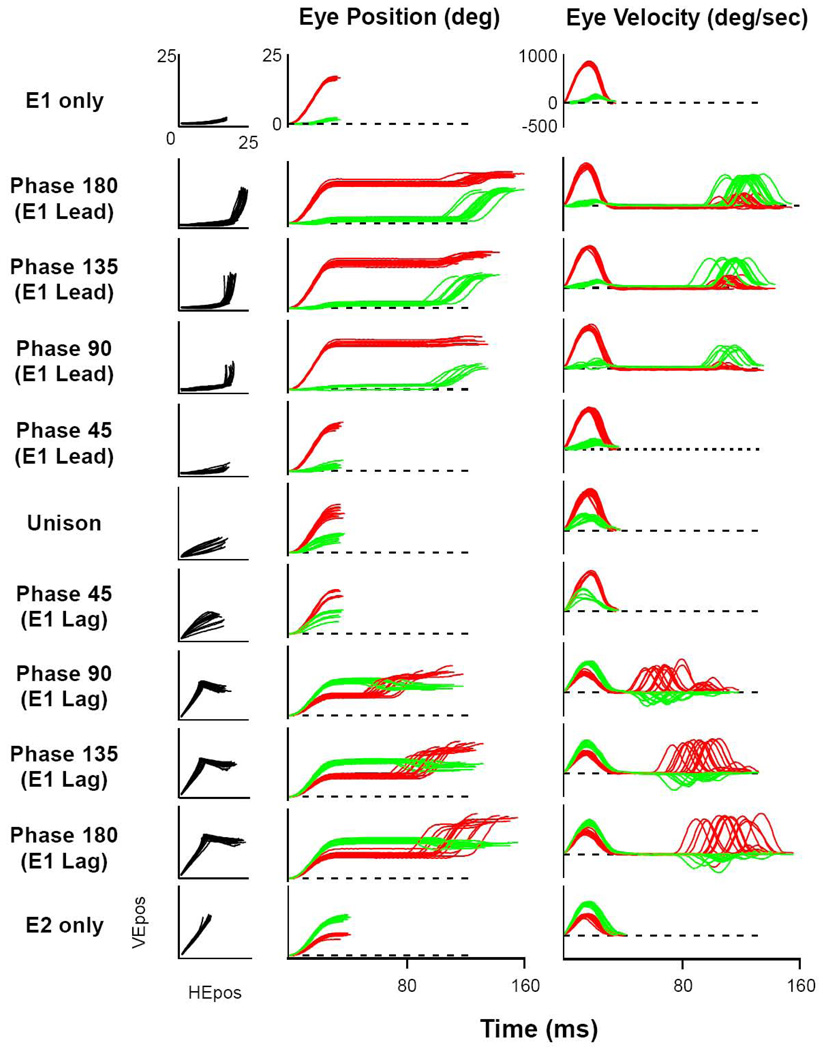
Figure 5. Exemplar Presentation of Complete Data Set for One Pair of Stimulation Sites.
Columns from left to right: phase, Cartesian plot, eye position in time, and eye velocity in time. Top and bottom rows illustrate the effect of stimulation at each site individually. The middle row shows simultaneous stimulation (Unison). Phase 180 (E1 lead) is shown in Figure 4. Phase between stimulation sites progresses down rows with 25 ms increments in delays, with E1 leading in the top half, to E2 leading in the bottom half. The Phase-45 rows demonstrate single, curved movements to closely overlapping stimulation waveforms (25 ms).

