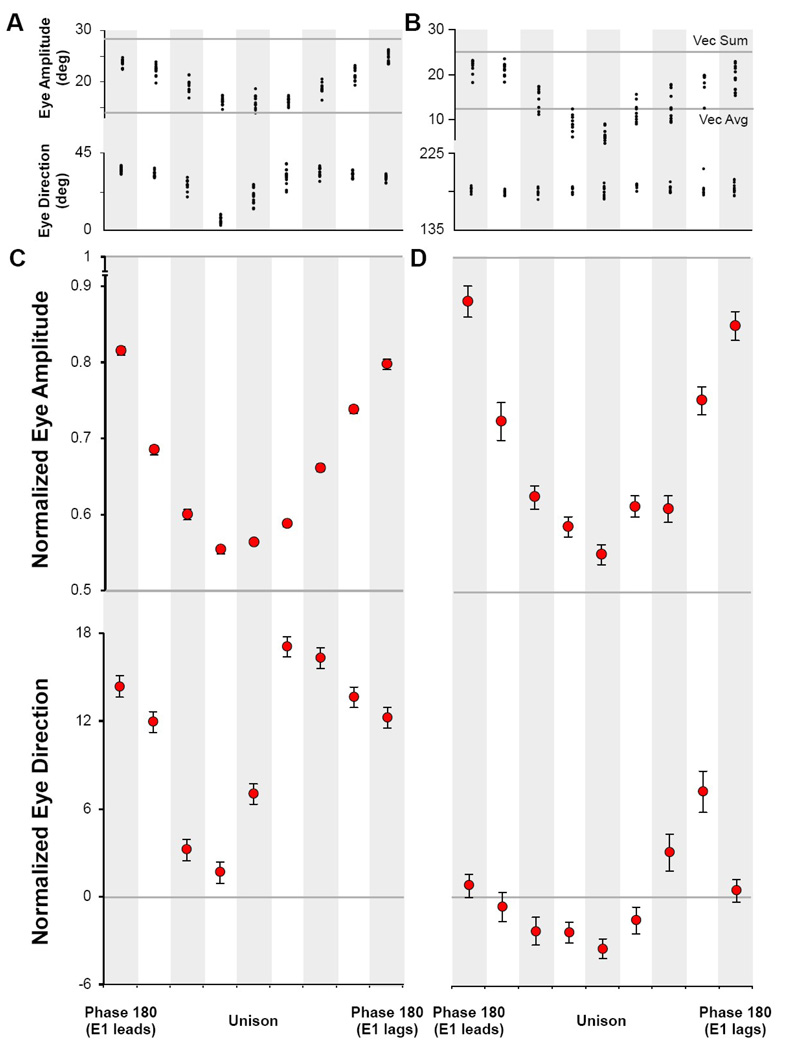
Figure 6. Analysis of Evoked Endpoints as a Function of Phase.
A) Subject MA and B) Subject SA, single experiments from a pair of electrodes during which all phase shifts were collected. Panels illustrate the eye amplitude and eye direction at the top and bottom, respectively, for each paired stimulation. Eye amplitude decreases in size as stimulation trains merge toward unison; eye direction changes with respect to the direction of the first saccade. C) A summary of all experiments in monkey MA and D) for monkey SA. Plots show the normalized mean and standard error for all data collected at each phase. The direction values were organized such that E1 always had the more downward value of the pair.

