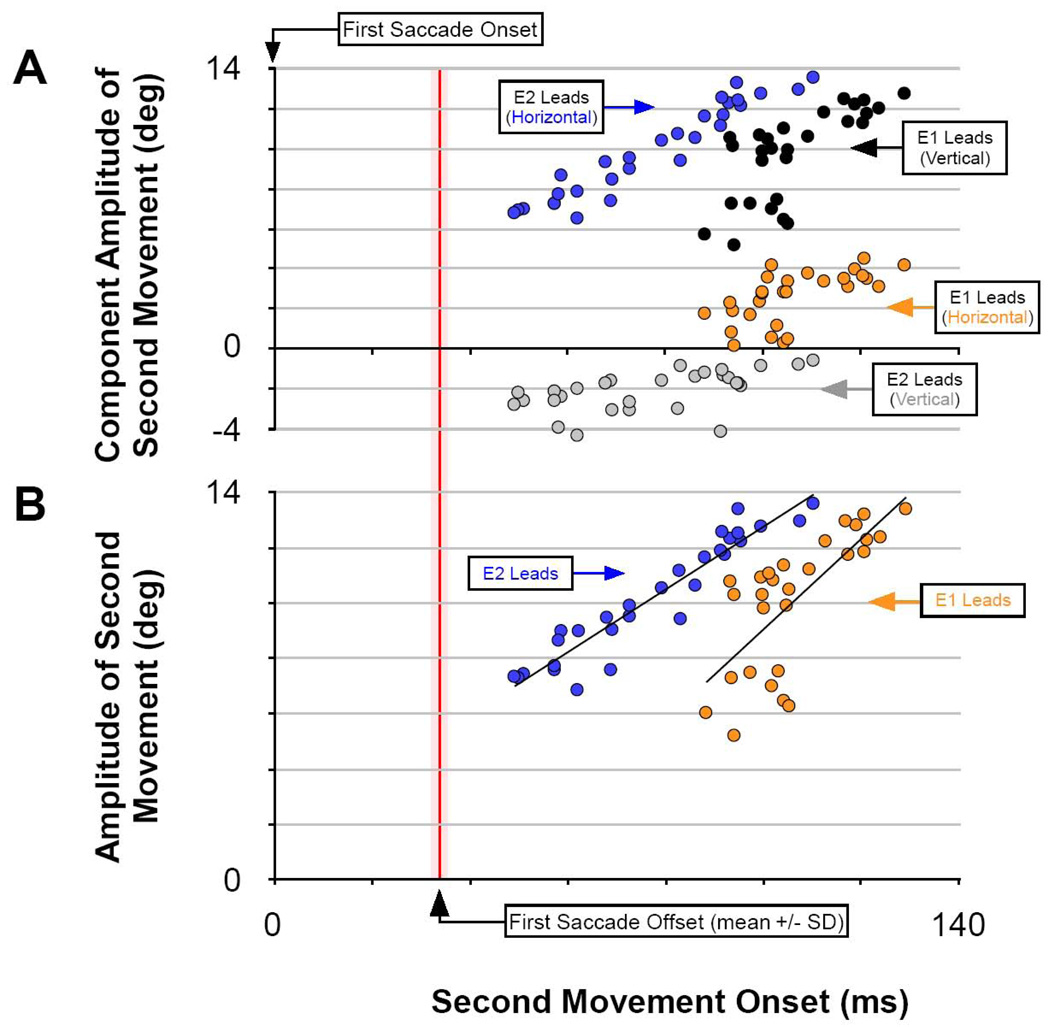
Figure 7. Analysis of the Amplitude of the Second Saccade.
A) The component amplitude of second saccades evoked in a single experimental series (see Figure 5 Phase 90 through Phase 180 for example). B) The same data as panel A plotted as radial eye amplitude and fit with a least-squared, linear regression. Second saccades decrease in size as their inception nears the end of the first saccade.

