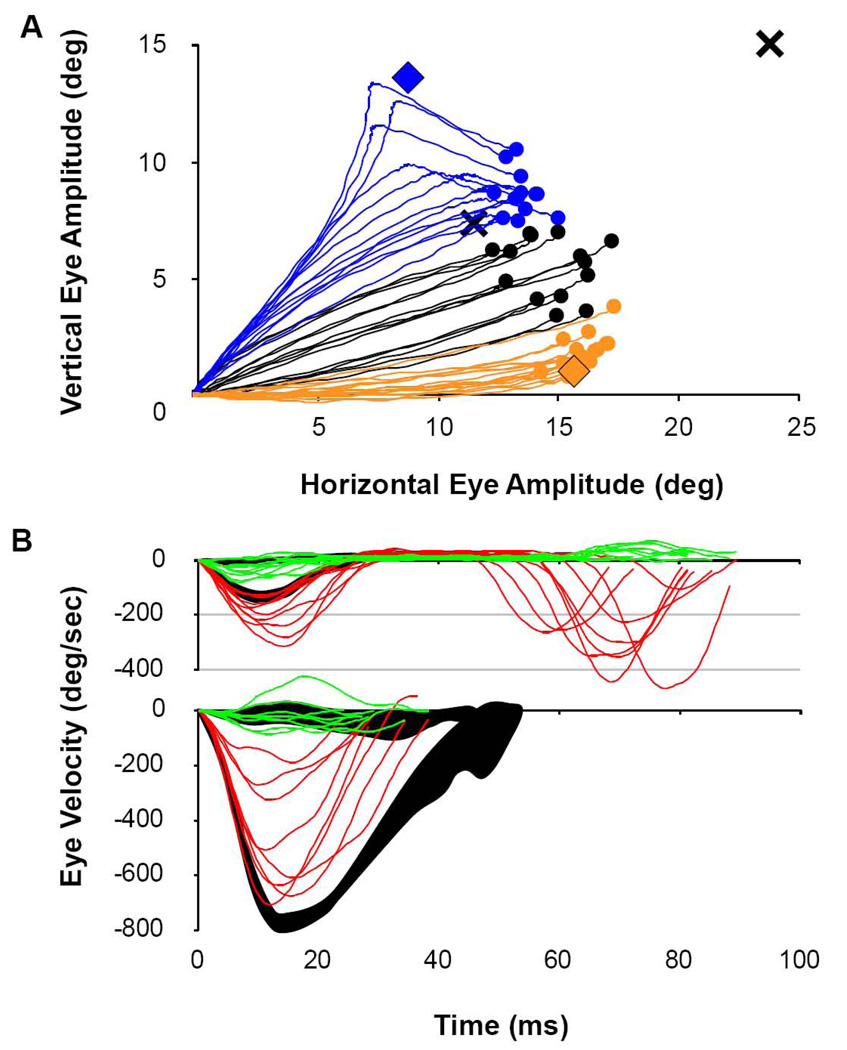
Figure 9. Comparison of Trajectories for Temporally-Colliding Movements.
A) Dynamic curvature of saccades caused by colliding stimulations. Here movements are caused by stimulation sites having similar amplitudes, but differing directions. Saccades are segregated based on which electrode was stimulated first. Orange traces and orange filled circles show the trajectory and endpoints of E1 stimulations leading E2 by 25 ms. Blue traces and blue filled circles show the trajectories for the reverse order of stimulation. Black traces and black filled circles illustrate the unison condition. The X at the far right top corner is the projected end point for a simple linear sum of E1 and E2, individually. The X nearer the end points of the evoked saccades is the value predicted from the formal vector average of E1 and E2. Orange and blue filled diamonds indicate the mean end points of stimulated saccades for E1 and E2, respectively. Note that none of the movements stopped moving prior to their final end position. B) Dynamic eye velocity profiles for movements having similar direction, but different amplitudes. Red traces illustrate the horizontal velocity component while green traces illustrate the vertical velocity component for each saccade. Top traces illustrate single trials of recruiting the smaller movement (2.7 deg) first, followed by a large movement of 22.6 deg. (antidromic, rostral-to-caudal pattern). Individual trials are superimposed onto the 95% confidence interval for the control condition of activating the rostral site alone (black shading). Bottom traces show single trials of recruiting the larger movement first, followed by the small one (orthodromic, caudal-to-rostral pattern), superimposed onto the control condition of activating the caudal site alone (black shading).

