
Figure 7.
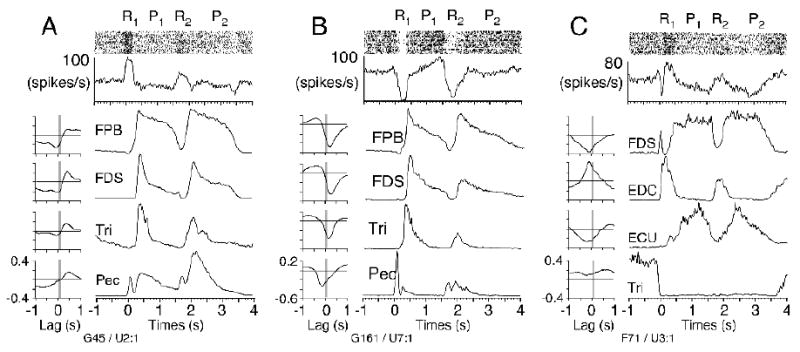
Raster plots, spike histograms, and EMG ensemble averages, all aligned to onset of reach to the center button (R1). In a single trial, the monkey reached toward (R1/R2) and pressed (P1/P2) two buttons sequentially. To the left are the cross correlation functions. The most strongly correlated muscle (plotted at the top of each panel) determined the sign of the correlation in Figure 6. (A) Quadrant IV example (G45 in Figure 6) was approximately out of phase with flexor pollicis brevis, causing a strong, negative correlation. (B,C) Quadrant III examples (G161, F71 in Figure 6), in which pauses in PC discharge were associated with increased muscle activity, also resulting in negative correlations. The biphasic discharge of the neuron in (C) was predominantly negative and its largest magnitude correlation was negative, with flexor digitorum sublimis. This placed it in quadrant III, despite the smaller positive correlations with other muscles.