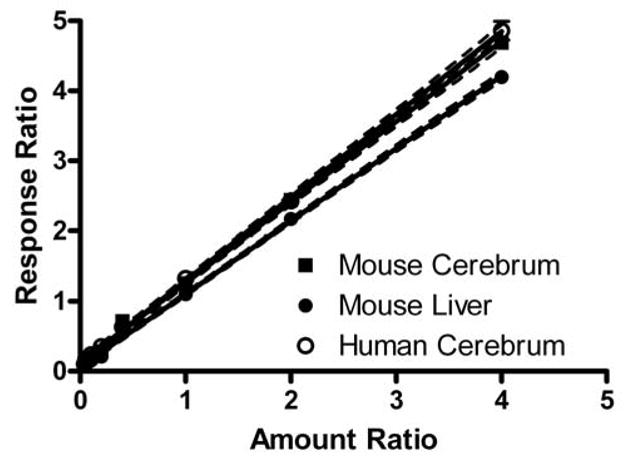
Figure 6. Calibration curve for D3-BMAA.

Solutions of 10 to 1000 pg/μl H3-BMAA and 250 pg/μl D3-BMAA were combined with homogenates of mouse liver or cerebrum, or human cerebrum for comparison, derivatized with ethyl chloroformate, and analyzed by GC/MS. The ratio of the amount of H3-BMAA to D3-BMAA in each sample was plotted against the ratio of relative response for m/z 116 (H3-BMAA) to m/z 119 (D3-BMAA). Linear regression analysis with 95% confidence intervals are plotted along with the seven amount ratios for each tissue homogenate (r2 = 1.00 and P < 0.0001 for each). Slope for mouse cerebrum and mouse liver were 1.15 ± 0.01 and 1.04 ± 0.01; human cerebrum yielded results virtually identical to mouse cerebrum.
