
Fig.3.
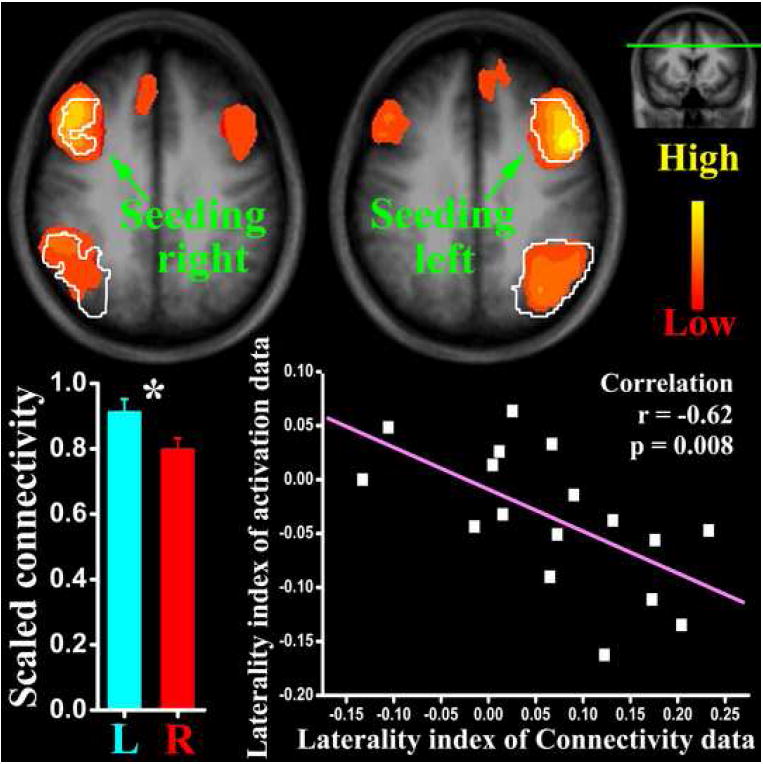
The results of resting connectivity data analysis. The two axial slices (position marked on a coronal image at the upper-right corner) show brain areas with resting signal significantly correlated, respectively, with the left and right prefrontal seeding areas (color coding here represents correlation coefficients; anatomical underlay is the mean of all participants). The white contour areas in these two images indicate the functionally defined ROIs showed in Fig.2. The bar graph shows significant (marked by the asterisk) hemispheric difference of scaled (to young level) prefrontal-parietal connectivity in the old group. The laterality index of resting connectivity and activation is negatively correlated as depicted in the dot-line plot.