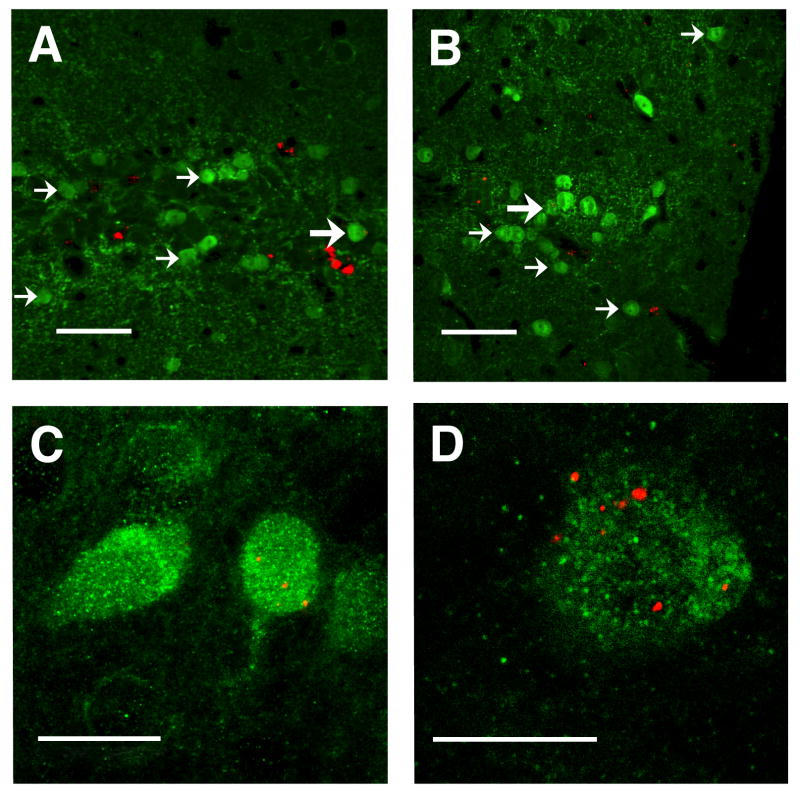
Figure 4.
Confocal analysis of transplanted GABAergic neurons. A & B, clusters of GABA-ir neurons (small arrows) are seen within the BLC, some of which (large arrows) contain red FMs. Note that non-GABAergic cells containing red FMs are also seen (arrow heads); section thickness: 4 μm. C, high power confocal image of GABA-ir neuron, one containing red FMs. D, confocal micrograph of a 0.5 μm optical section through GABA-ir cell (green) labeled with red FMs. Scale bars: A & B = 50 μm, C = 20 μm, D = 10 μm

